Why Gold is Making Headlines
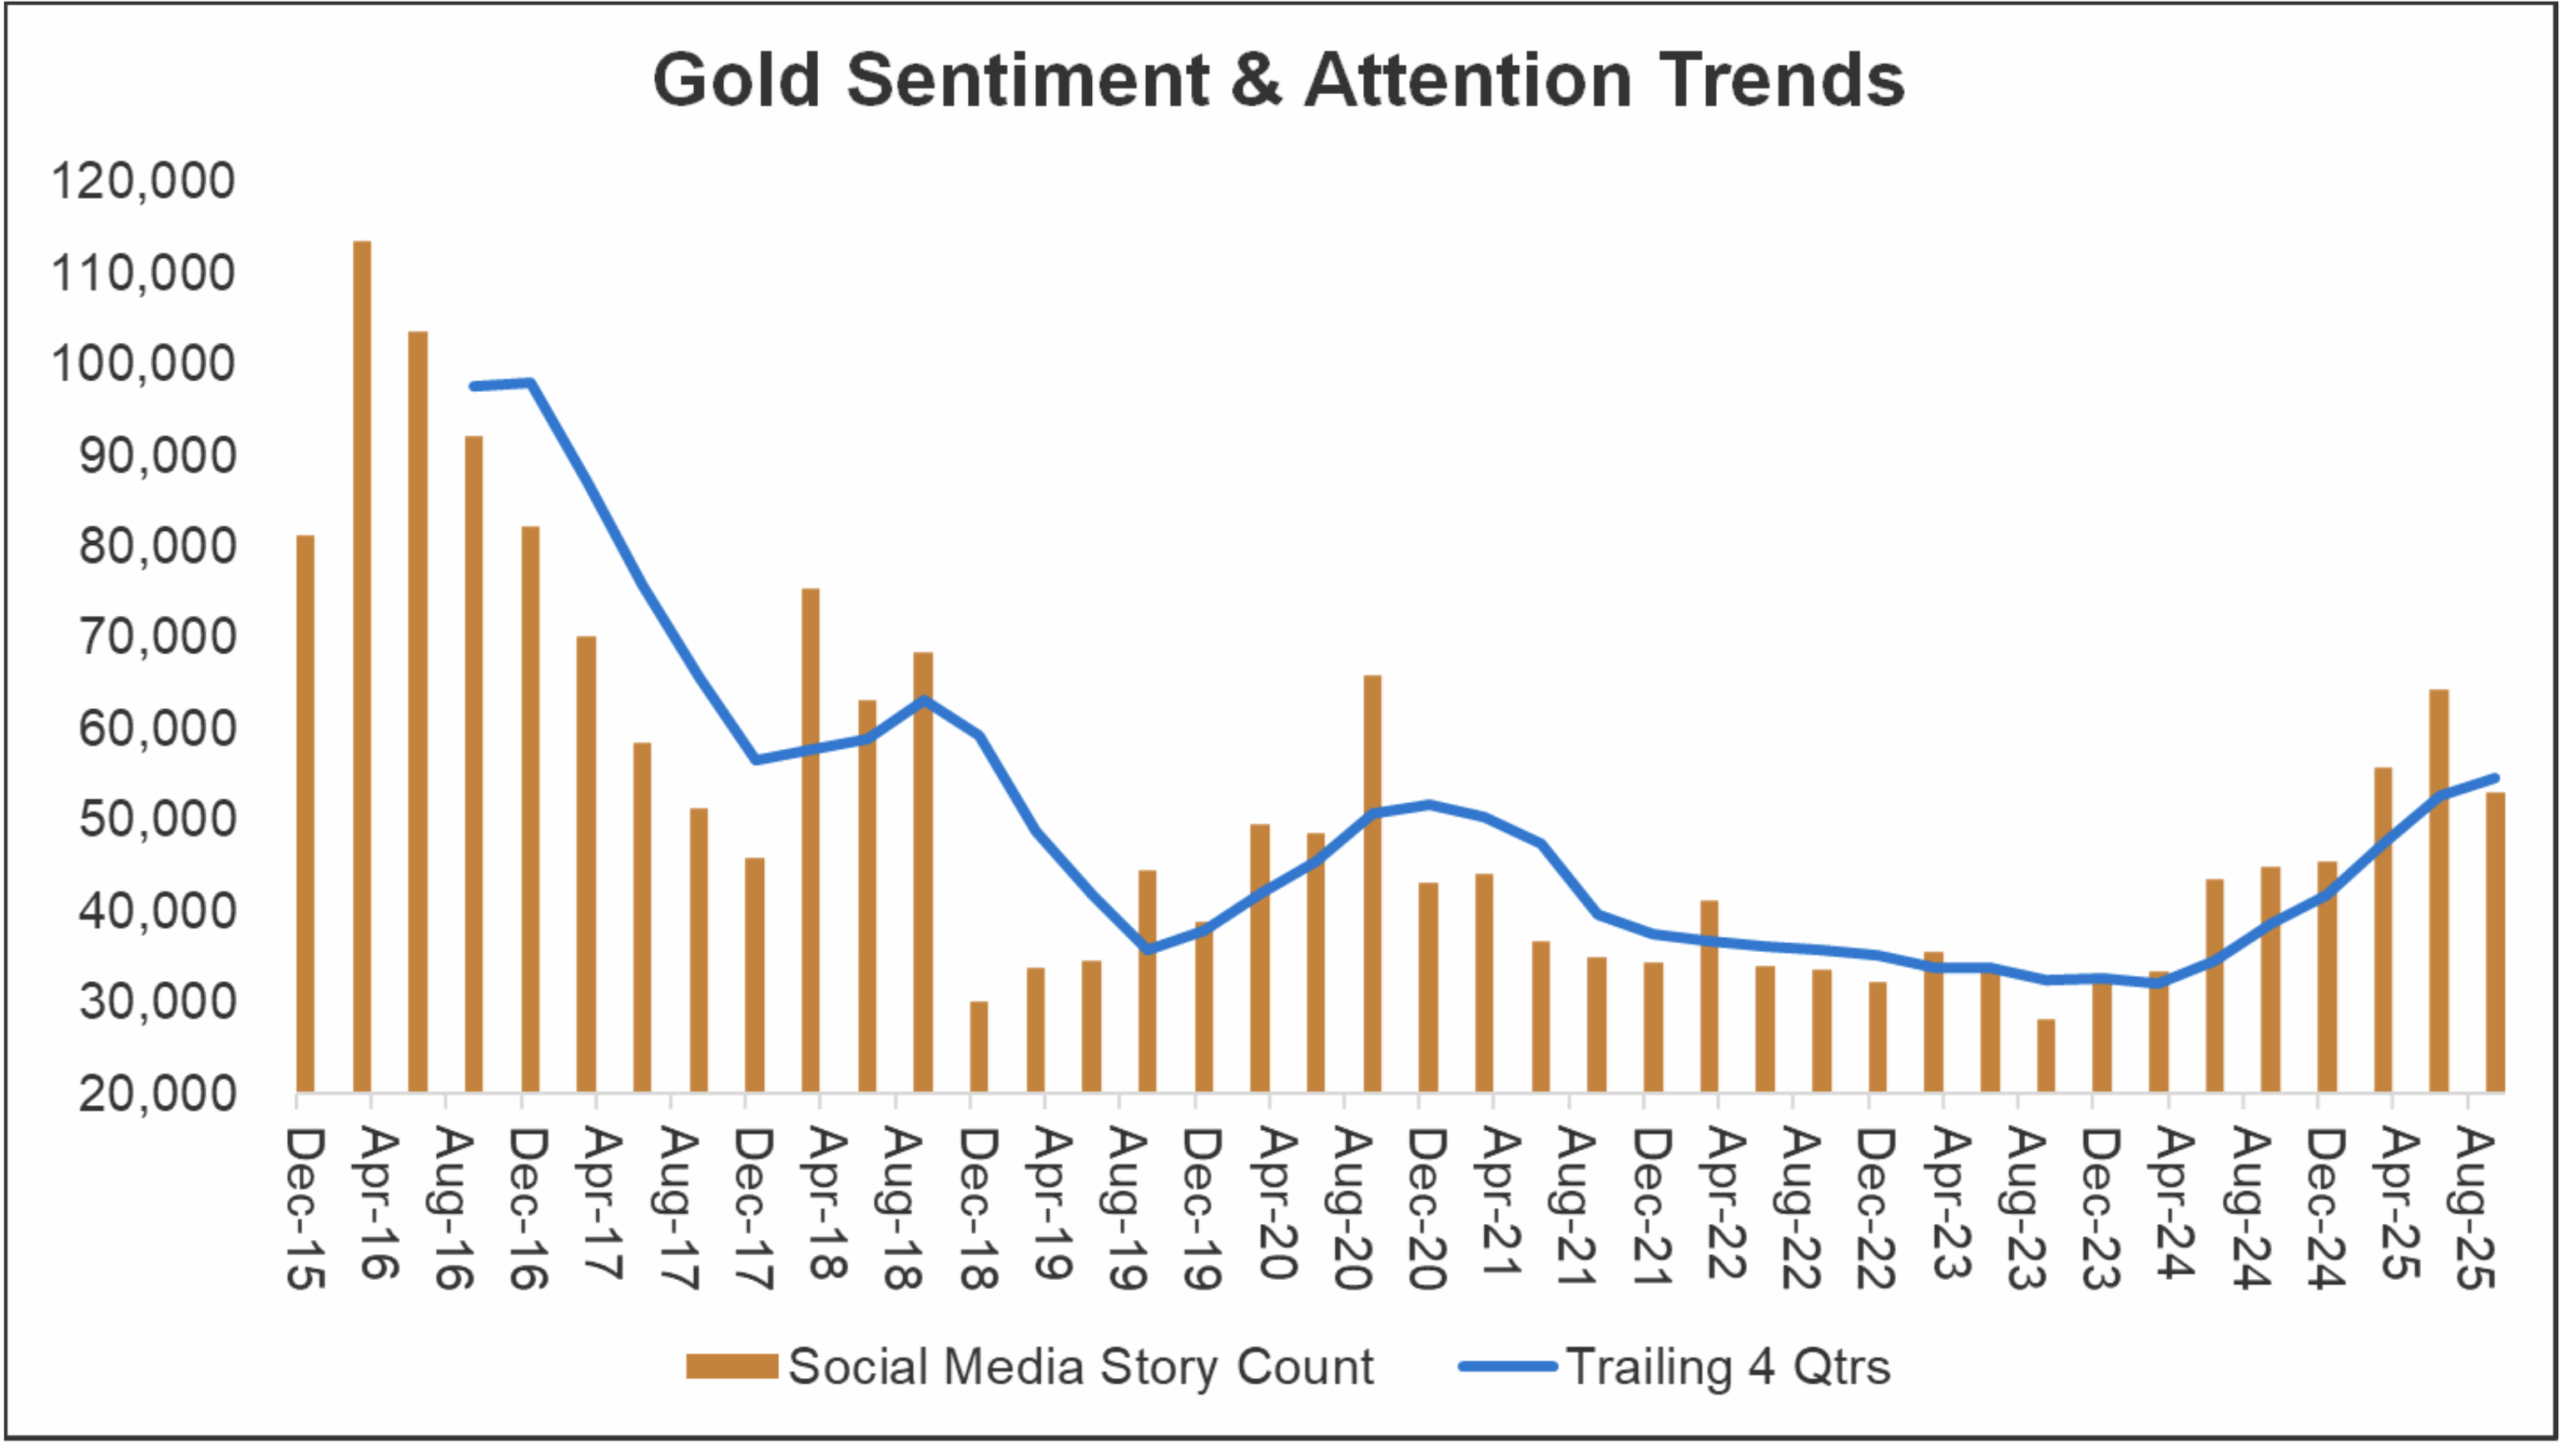
Has gold recently caught your attention? Perhaps you’ve heard financial reporters discuss it or noticed news articles and social media posts on the topic. If so, you’re not alone. Gold has been an increasingly popular subject lately. Over the past four quarters, social media mentions of gold have risen by more than 40% year-over-year. While current levels are still 40% below the peak seen in 2016, this growth is notable and likely explains why you may have encountered the topic yourself.
Source: Bloomberg
What is driving this renewed interest in gold? Gold’s recent price performance may help answer that question. According to data from Bloomberg, gold rose 47.04% year-to-date through the end of Q3 2025. Since 1971 – the year President Nixon officially ended the ability of foreign central banks to redeem U.S. dollars for gold – gold has only posted greater year-to-date through Q3 gains on three separate occasions. This occurred in 1972, 1973, and 1979. This year’s increase is also high compared to the average of 8.81% and median of 5.66%.
What is Gold?
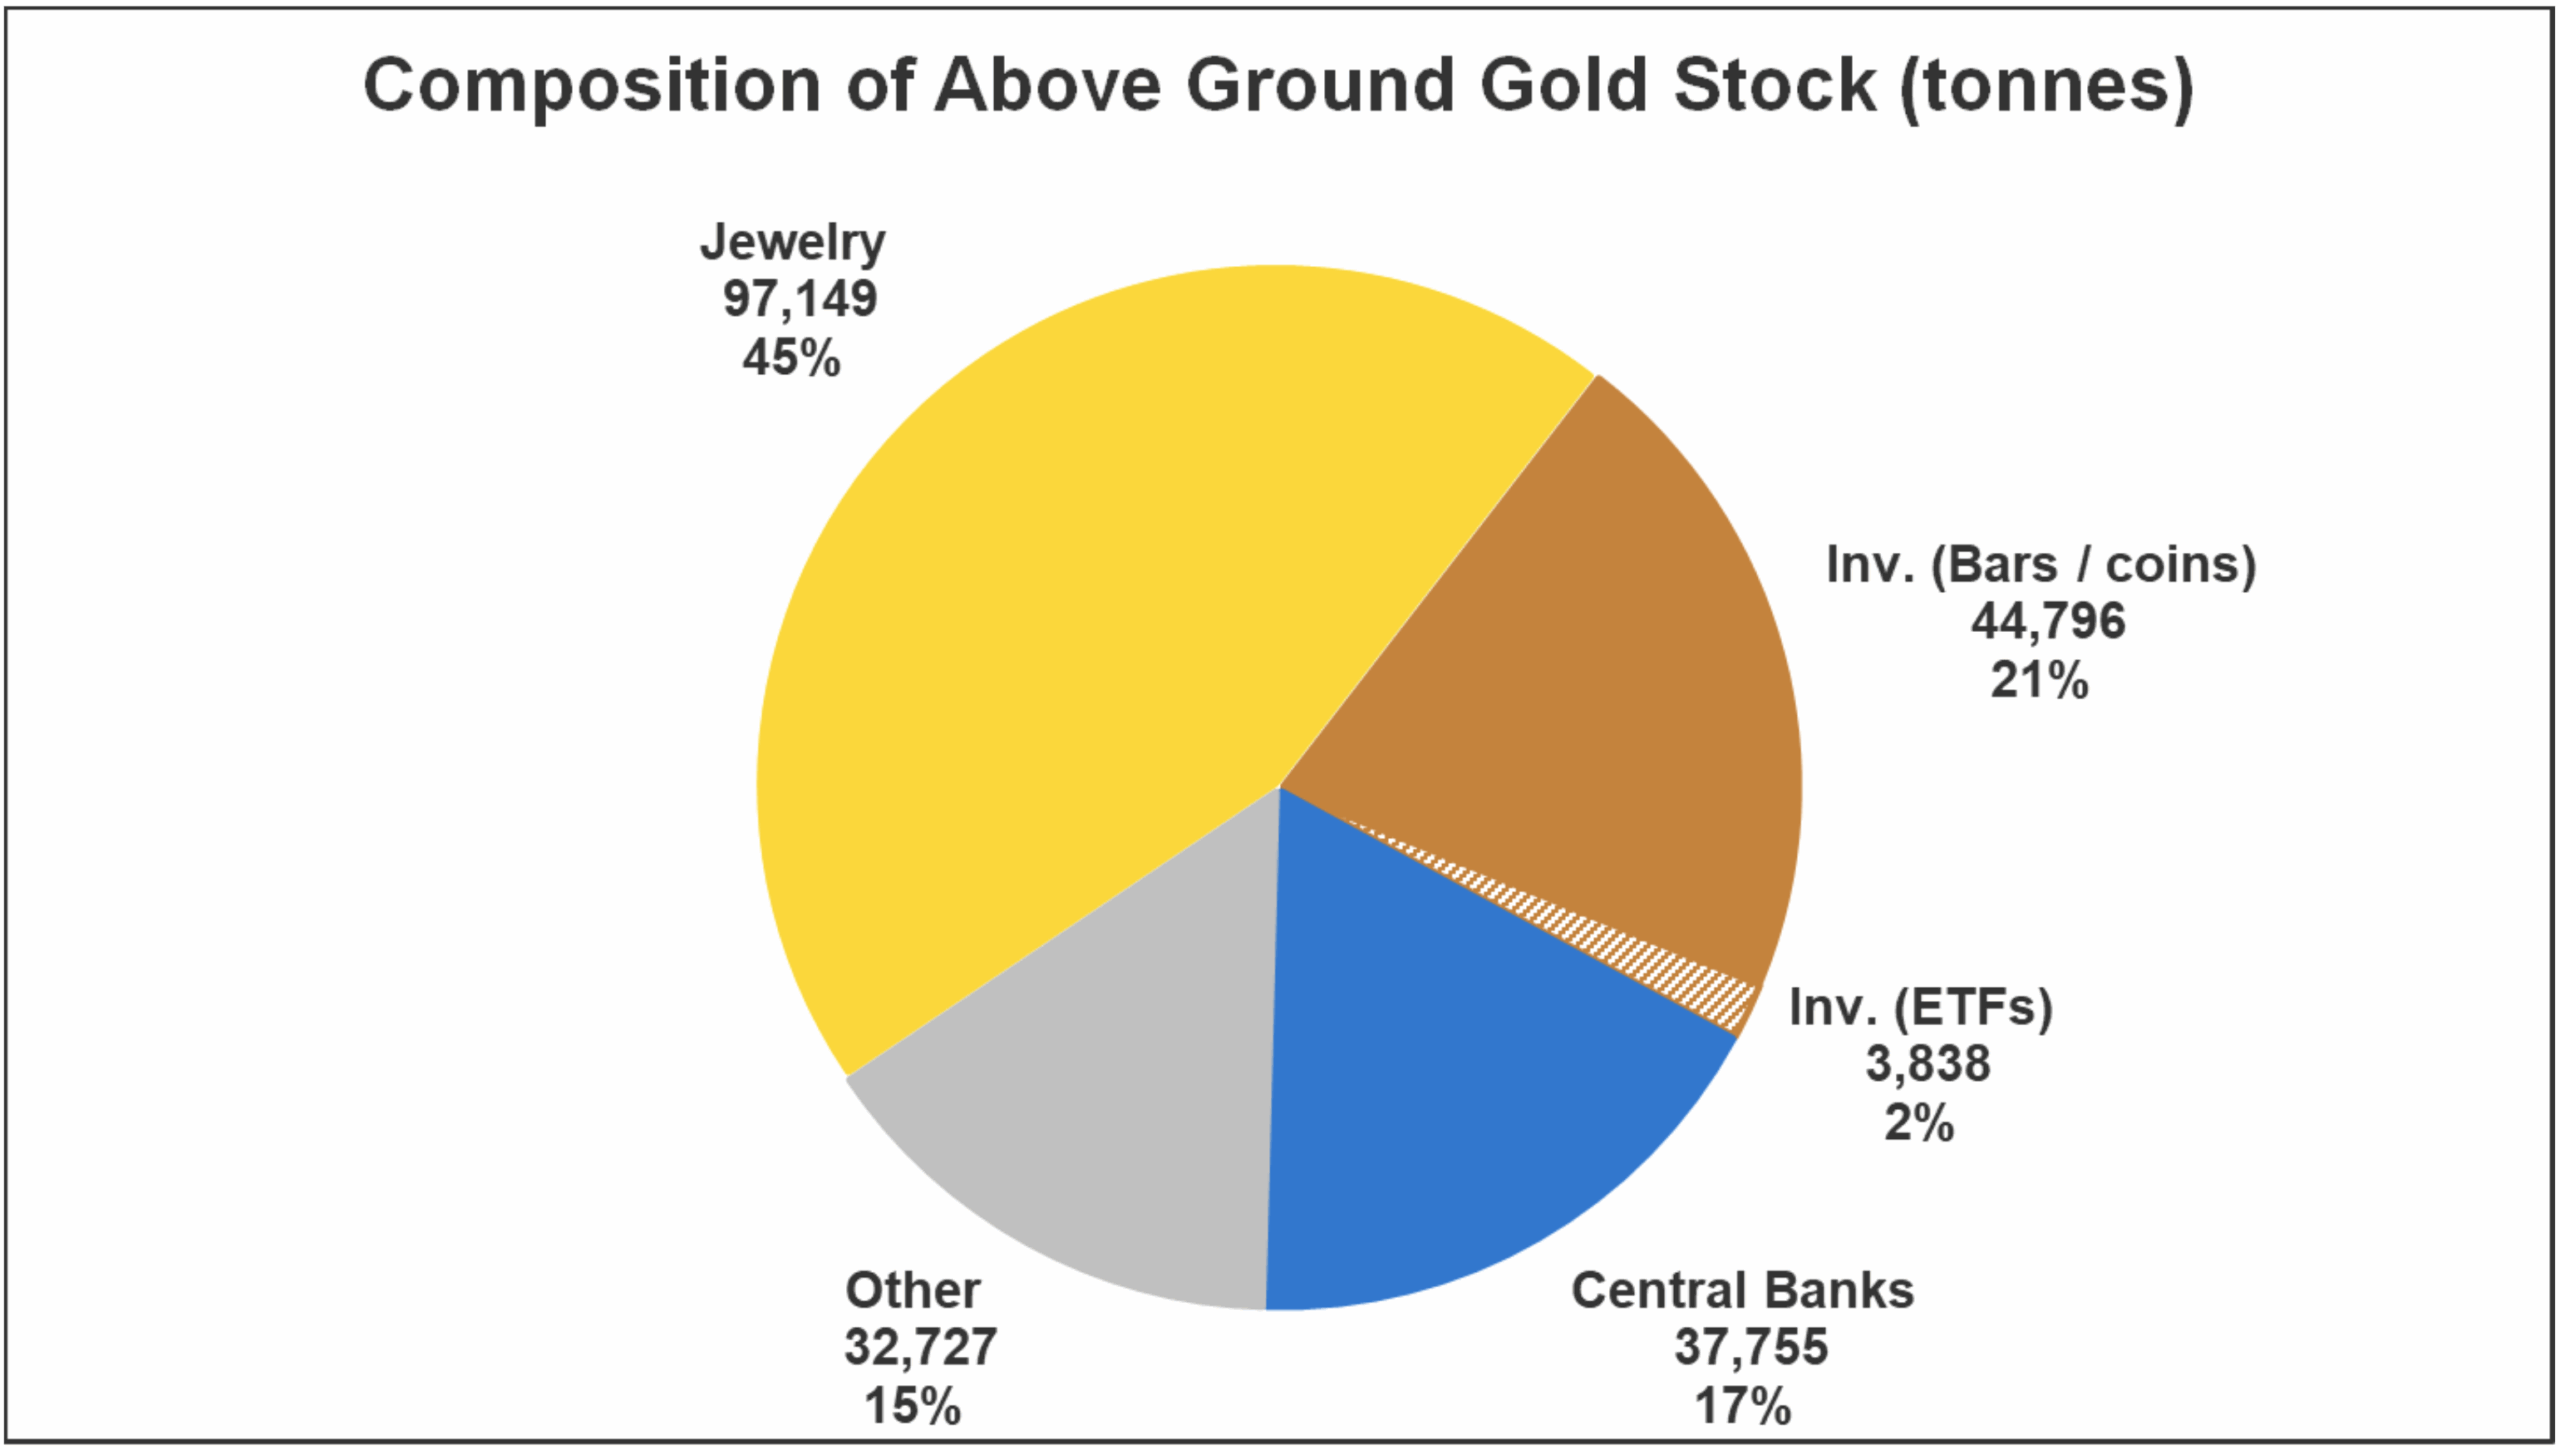
According to Encyclopedia Britannica, gold is a naturally occurring chemical element that is known for its distinctive yellow color, malleability, and resistance to tarnish and corrosion. Its conductive properties make it valuable in industrial and electrical applications. Humans have used gold for at least 6,000 years, both as jewelry and as a form of money. Due to gold’s unique qualities described above, nearly all the gold ever mined in the world still exists today. As of the end of 2024, the World Gold Council estimates that this collective stock is 216,265 tonnes – enough to fit into a cube measuring just 73 feet on all sides!
How Gold is Used Today
Today, almost half of the gold in the world is jewelry. Many countries have strong cultural ties with gold. In India and China for example, gold is commonplace at weddings and is known to signify wealth, prosperity, and longevity. Investments, including gold bullion and gold-backed exchange-traded funds (ETFs) account for 23% of the world’s gold. With advances in technology and the development of fractional reserve banking, the world has shifted from using commodity-backed money (money backed by something physical like gold) in favor of banknotes consisting of credit-based money (money backed by trust in the issuer and promise of repayment). Even with this shift, it is notable that central banks themselves still hold 17% of the world’s gold.
Source: World Gold Council
If people are no longer using gold coins or gold-backed paper banknotes to conduct payments, why do central banks still hold almost 1/5th of all the world’s gold? According to the World Economic Forum, central banks hold gold primarily to promote stability during economic turmoil, hedge against the eroding purchasing power of currencies due to inflation, and to diversify reserves as gold has an inverse correlation with the U.S. dollar. Citibank adds that as gold’s value is intrinsic and not tied to any single sovereign entity, it is increasingly seen by central banks as a hedge against volatility and geopolitical risk.
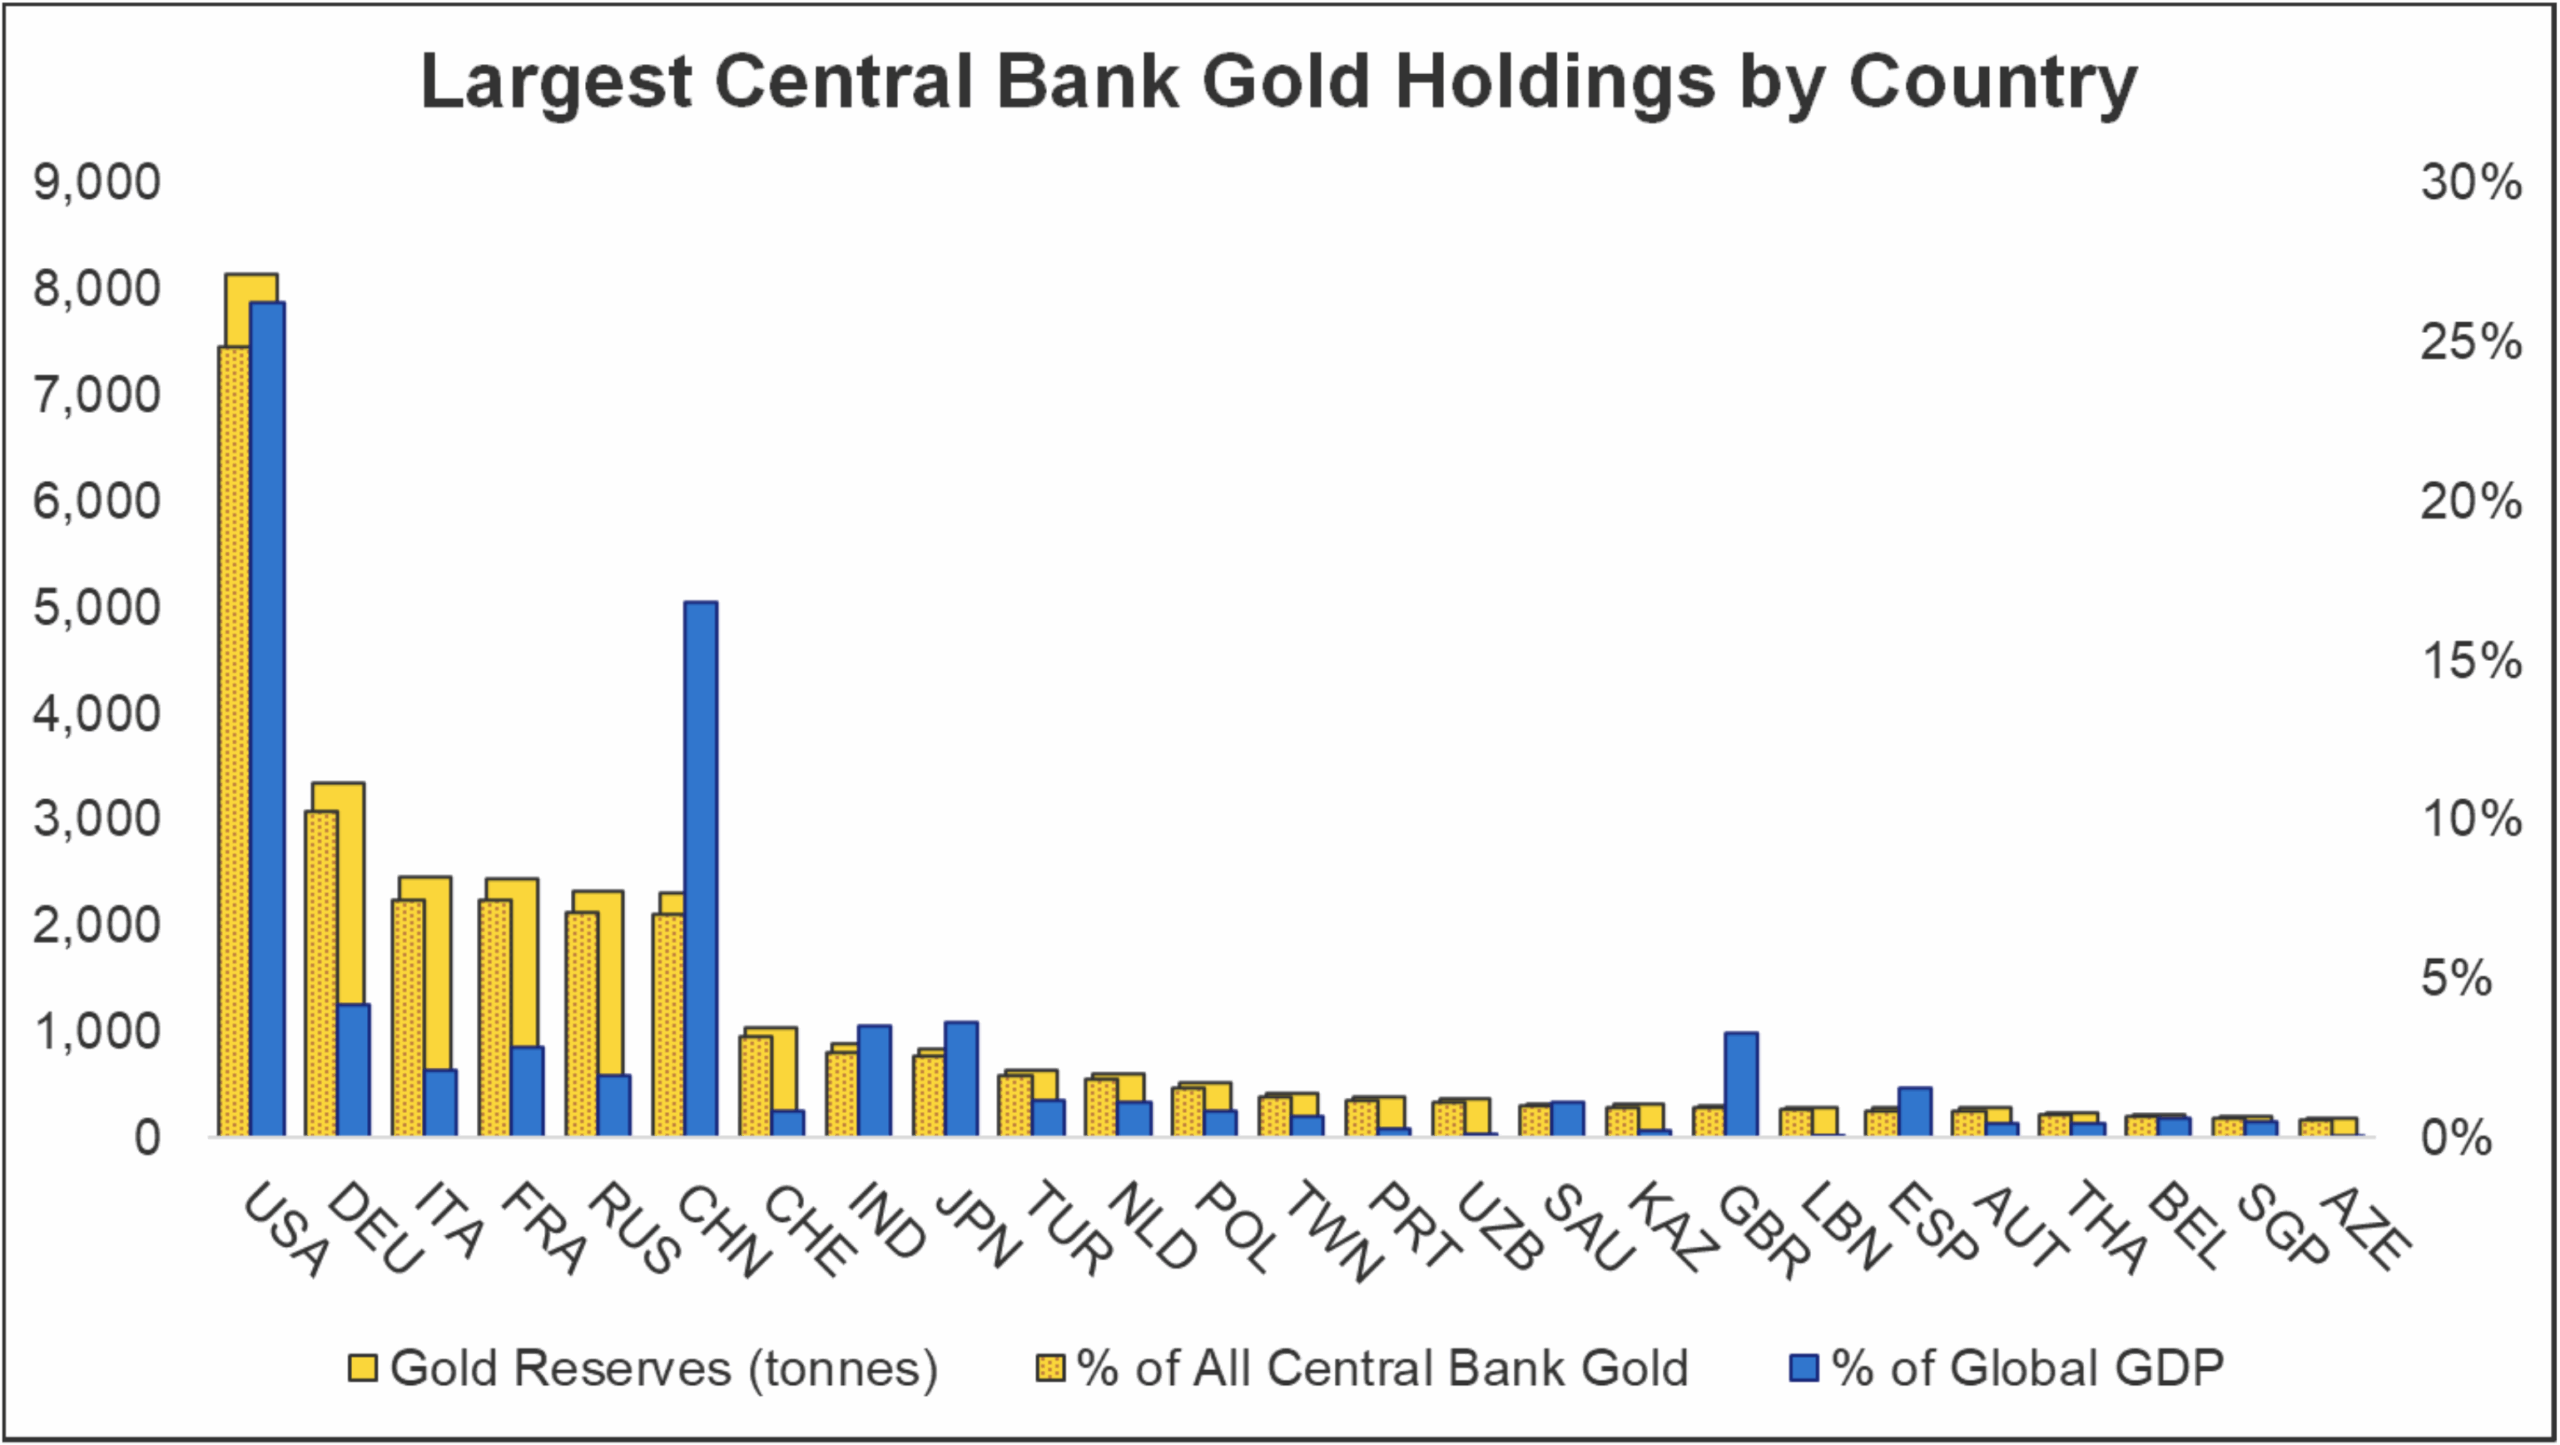
The following chart shows the 25 largest countries in terms of their central bank gold reserve holdings. Of note, the U.S. is first with over 8,000 tonnes and China is sixth with over 2,000 tonnes. The gold reserves of these 25 countries make up 90% of global country gold reserves and these countries collectively represent 75% of global GDP.
Source: World Gold Council, World Bank Group
Global Demand Trends for Gold
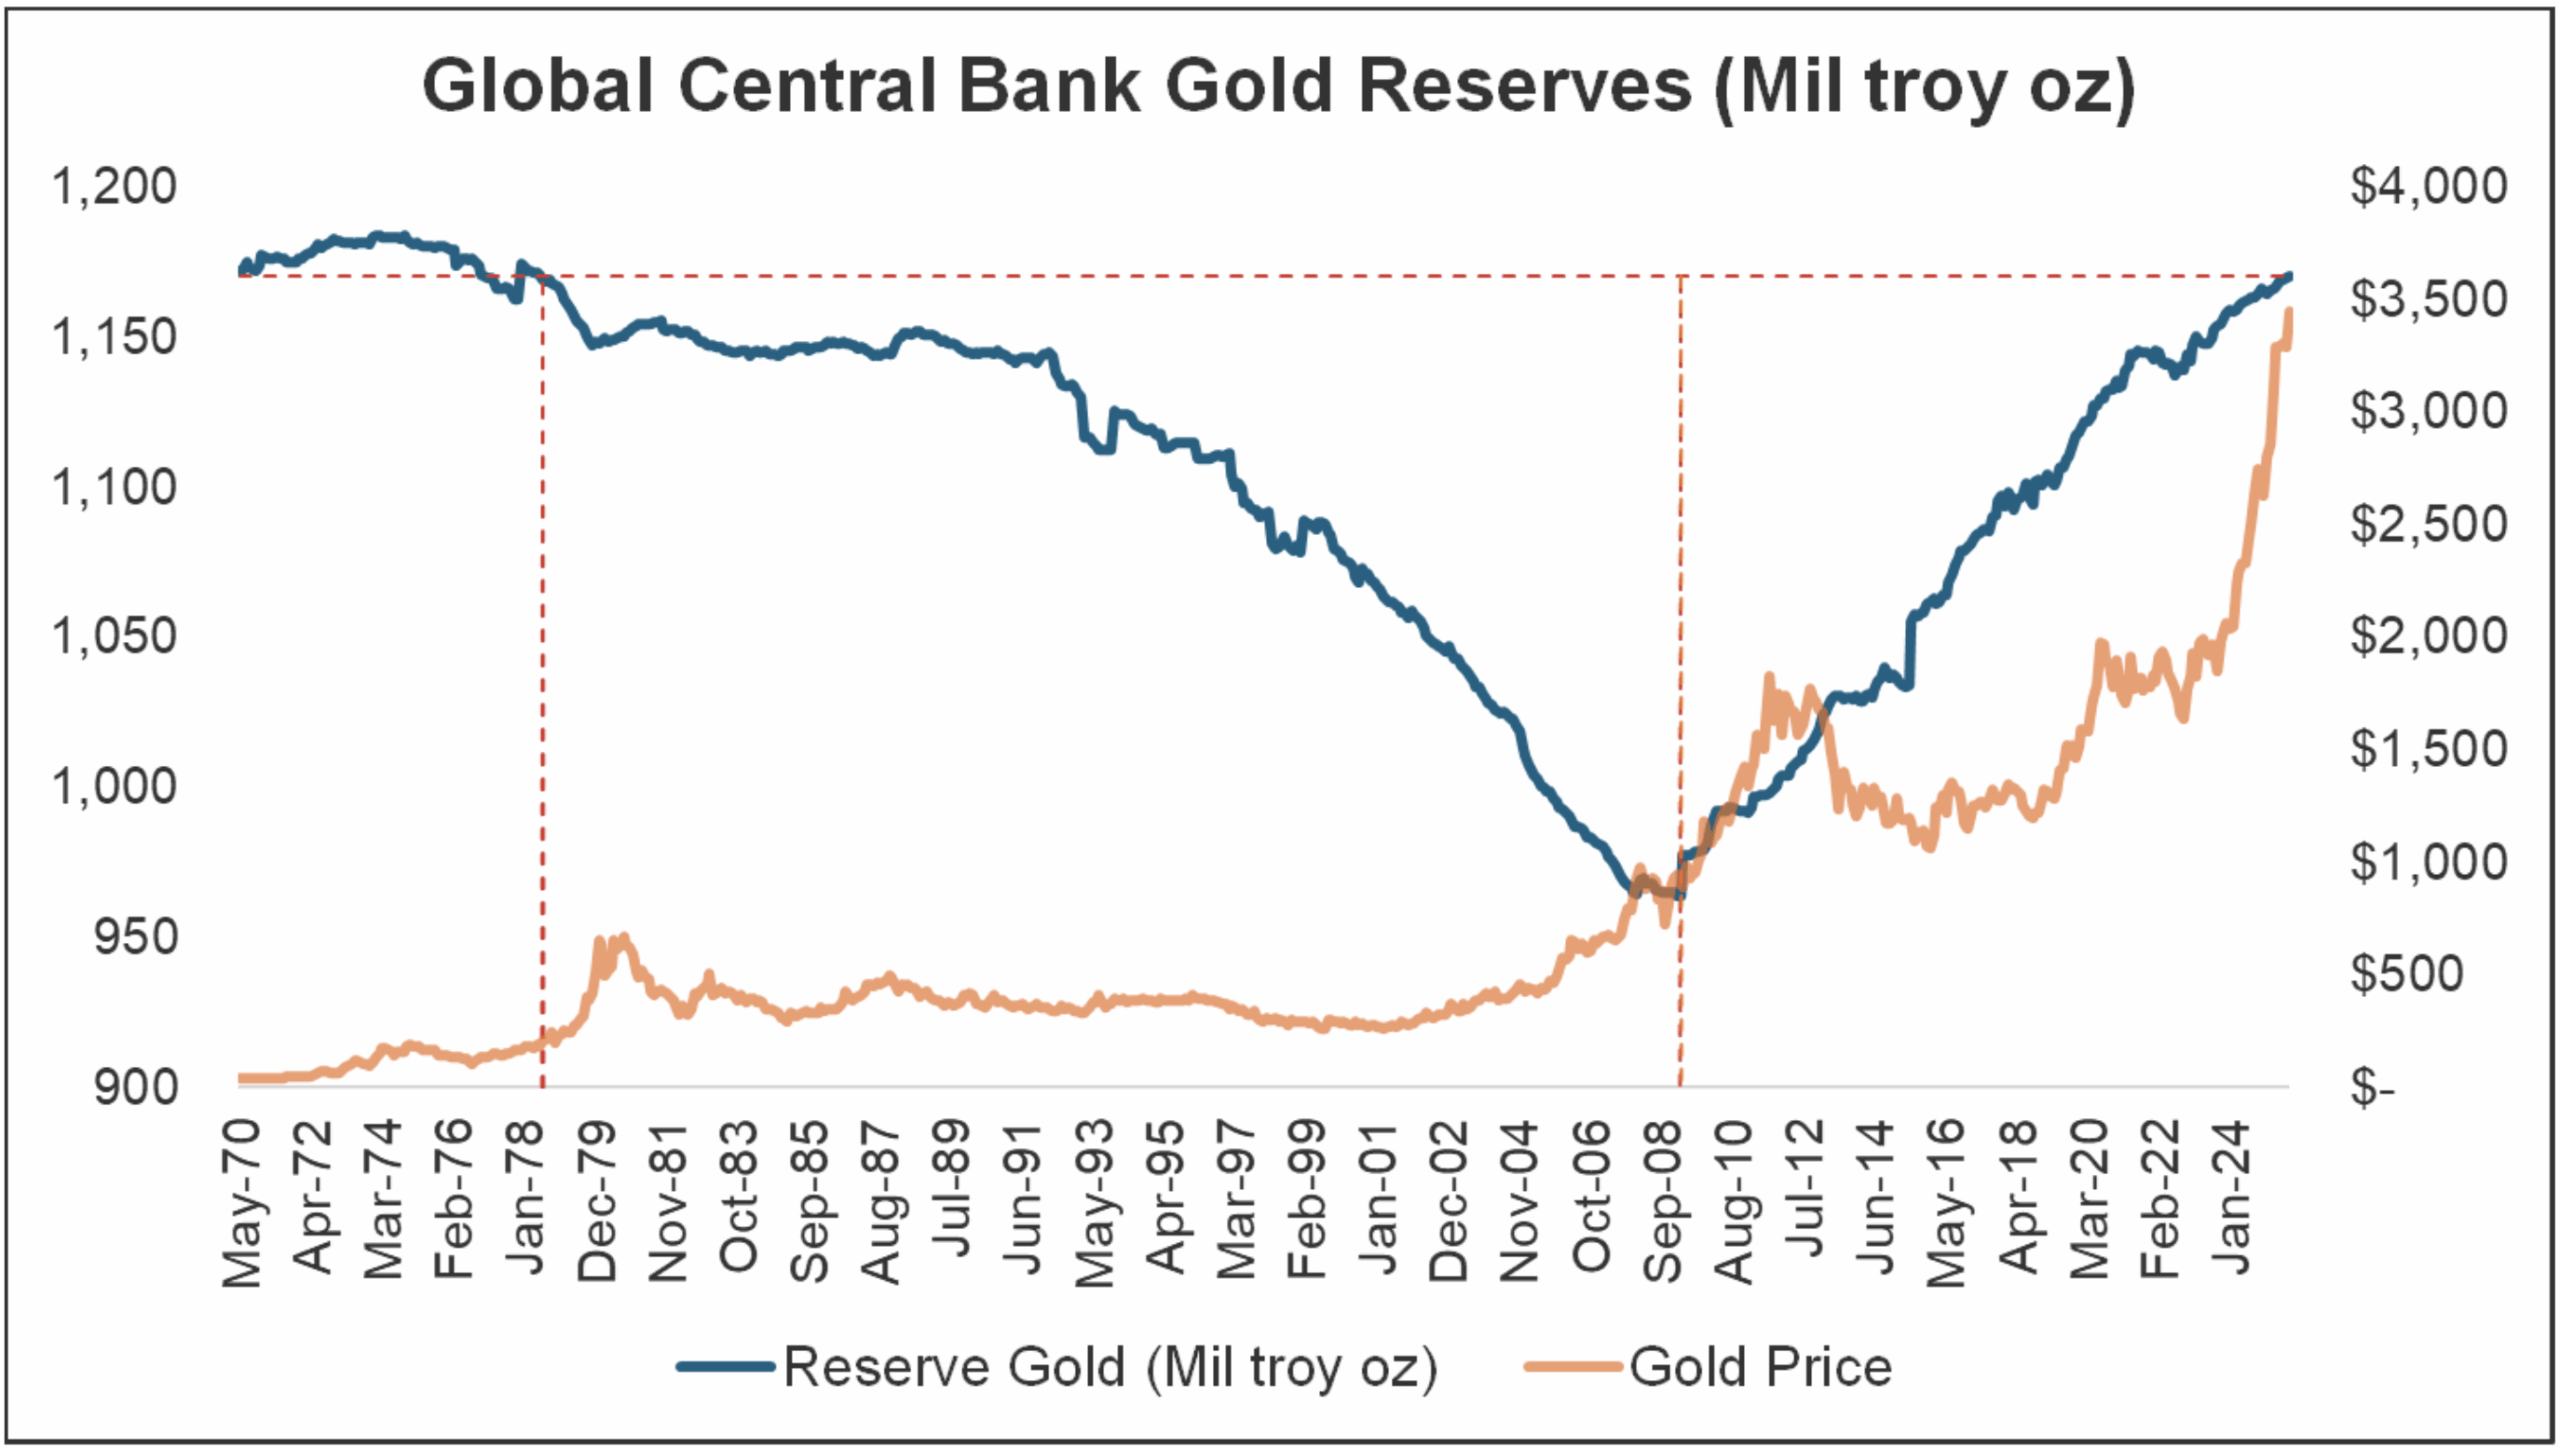
Global central bank gold reserves made a relative peak in 1974 before beginning a long decline lasting 35 years. The decline ended in March of 2009 at the depths of the financial crisis as global central banks collectively began growing gold reserves again. Since then, reserves have climbed to levels last seen in 1978 and continue to rise. China, Russia, and India account for the majority of these gold purchases, though other developing countries have also been buyers. Notably, after Russia’s foreign exchange reserves were frozen following its 2022 invasion of Ukraine, central bank gold purchases accelerated. Since then, the pace of purchases has averaged 2.4 times higher compared to the same period preceding the invasion.
Source: Bloomberg
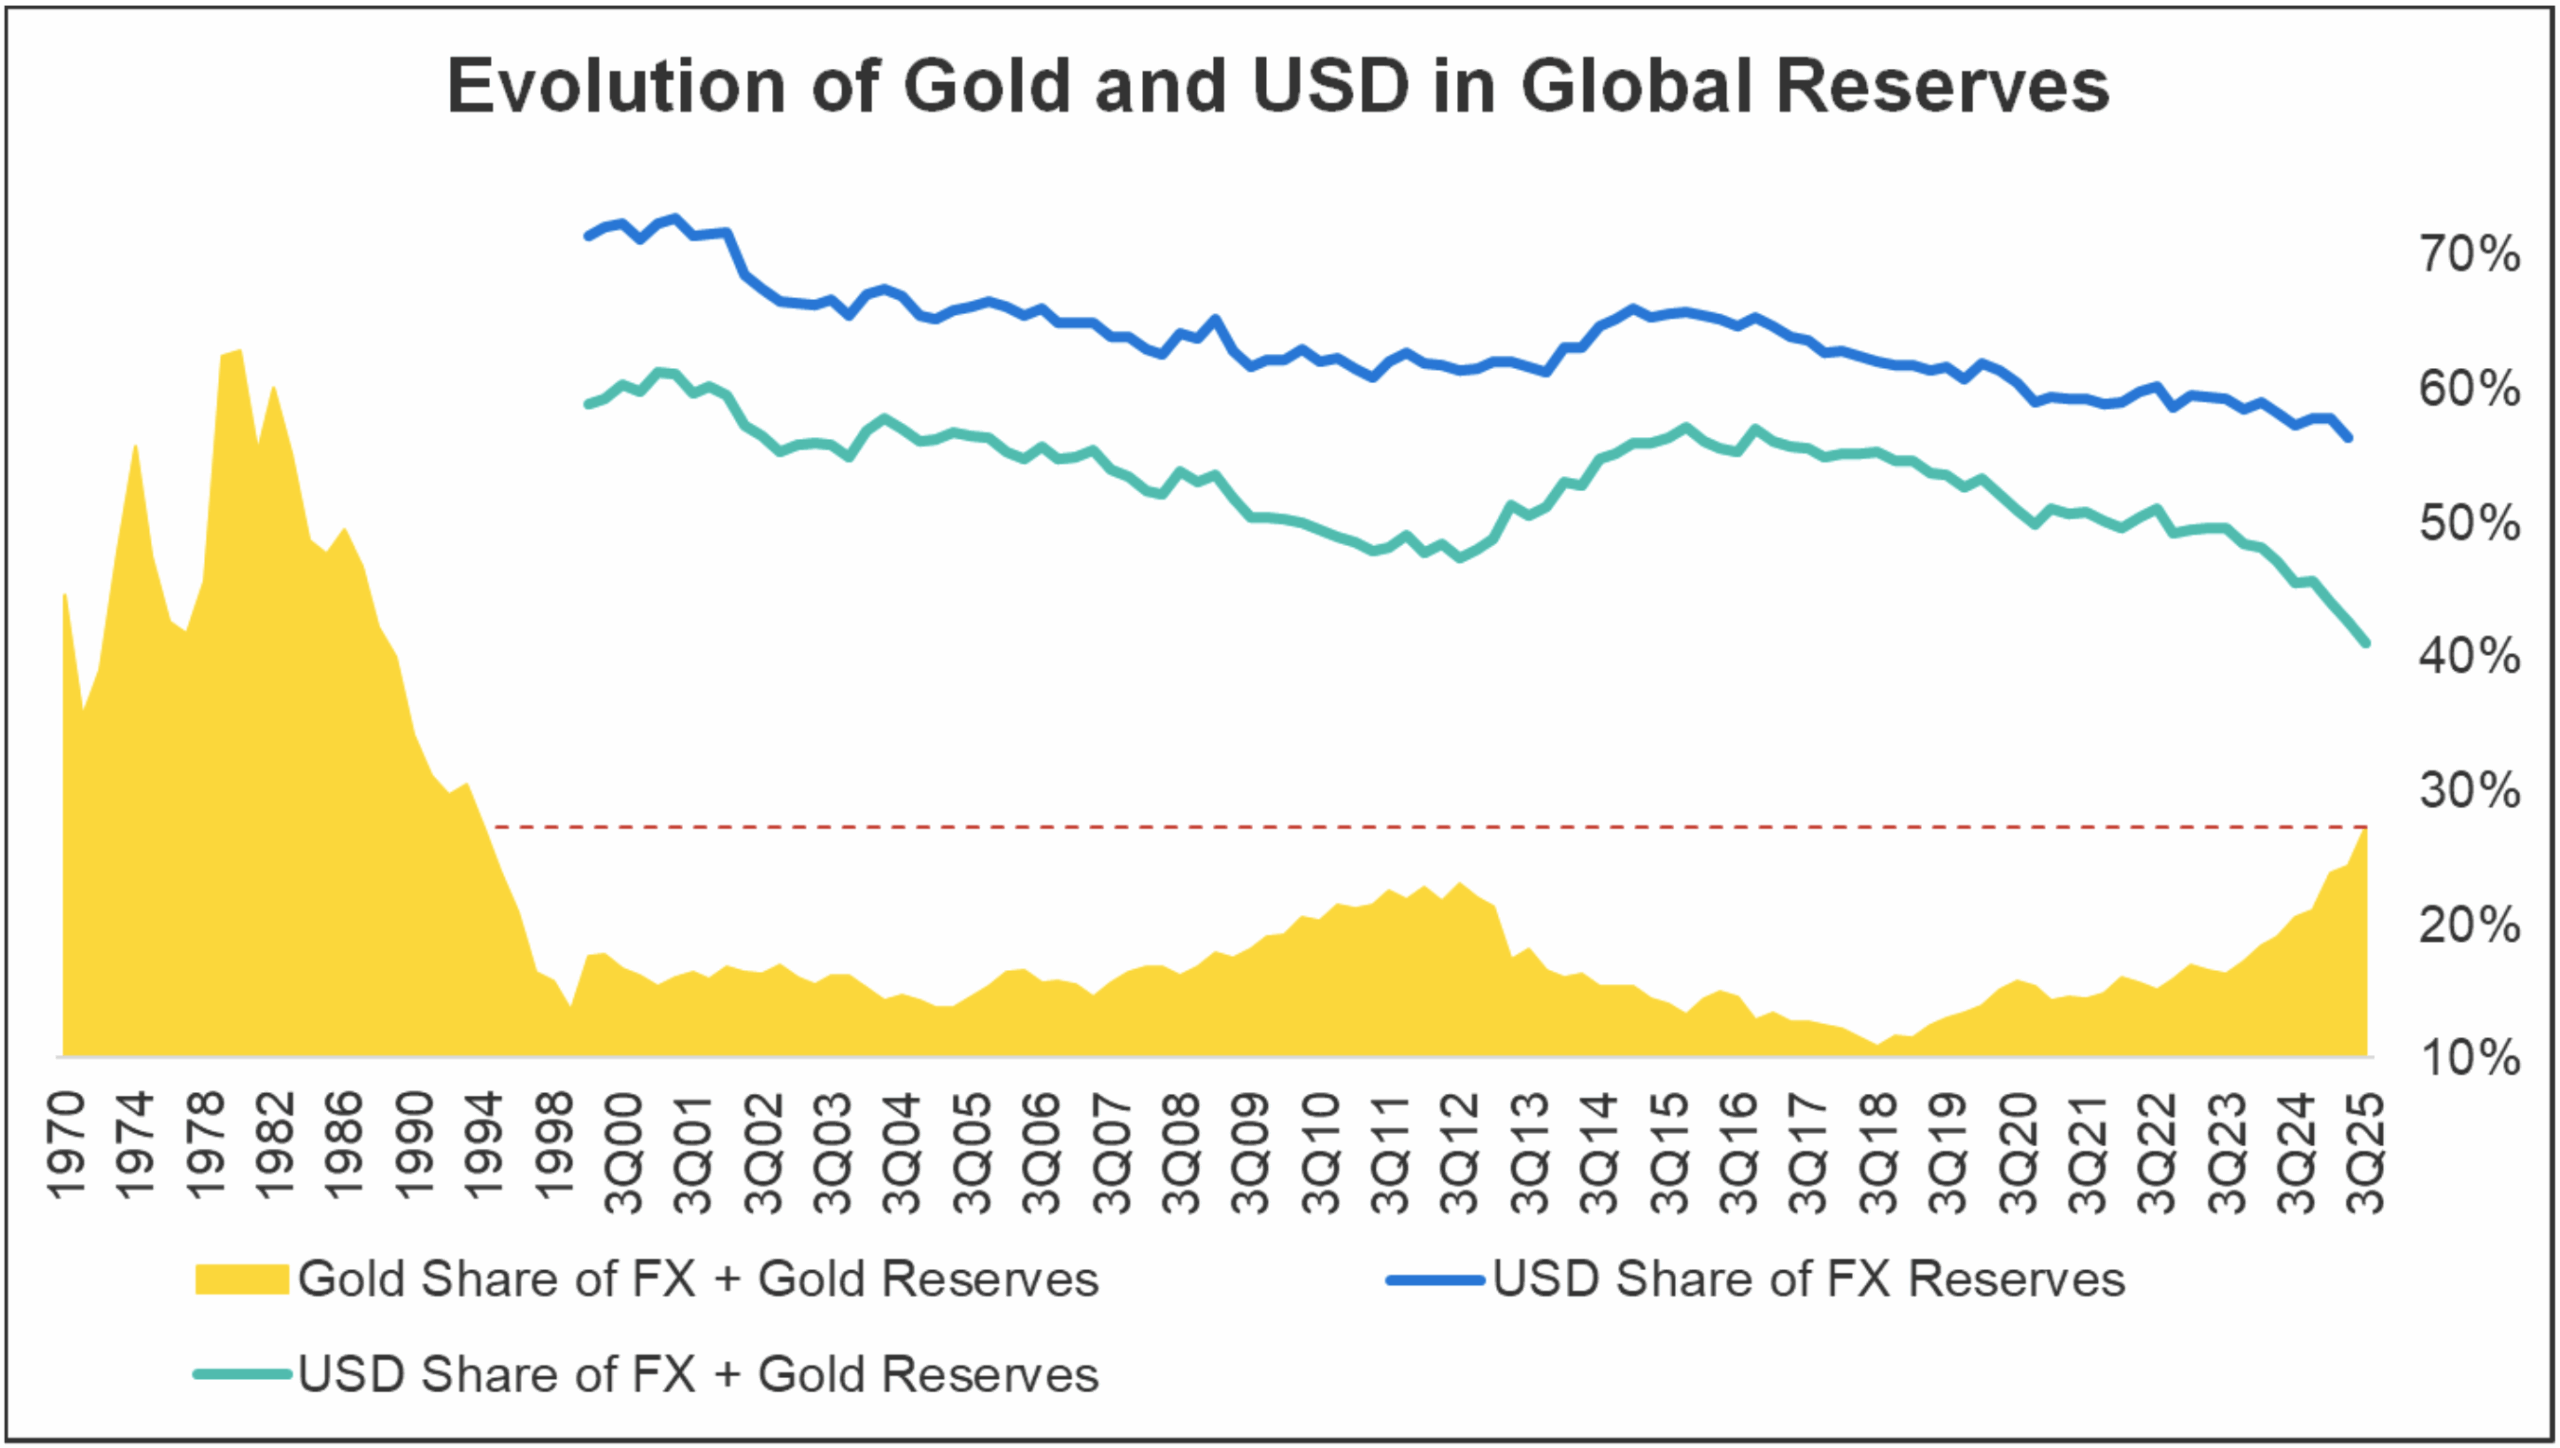
Central bank buying and rising gold prices have pushed gold to nearly 30% of global foreign exchange (FX) and gold reserves – the highest share since 1994. While the U.S. dollar remains the dominant percentage of global foreign exchange reserves, its share has been declining from a relative peak in 2015 and now accounts for less than half of foreign exchange reserves when including gold.
Source: Bloomberg, IMF
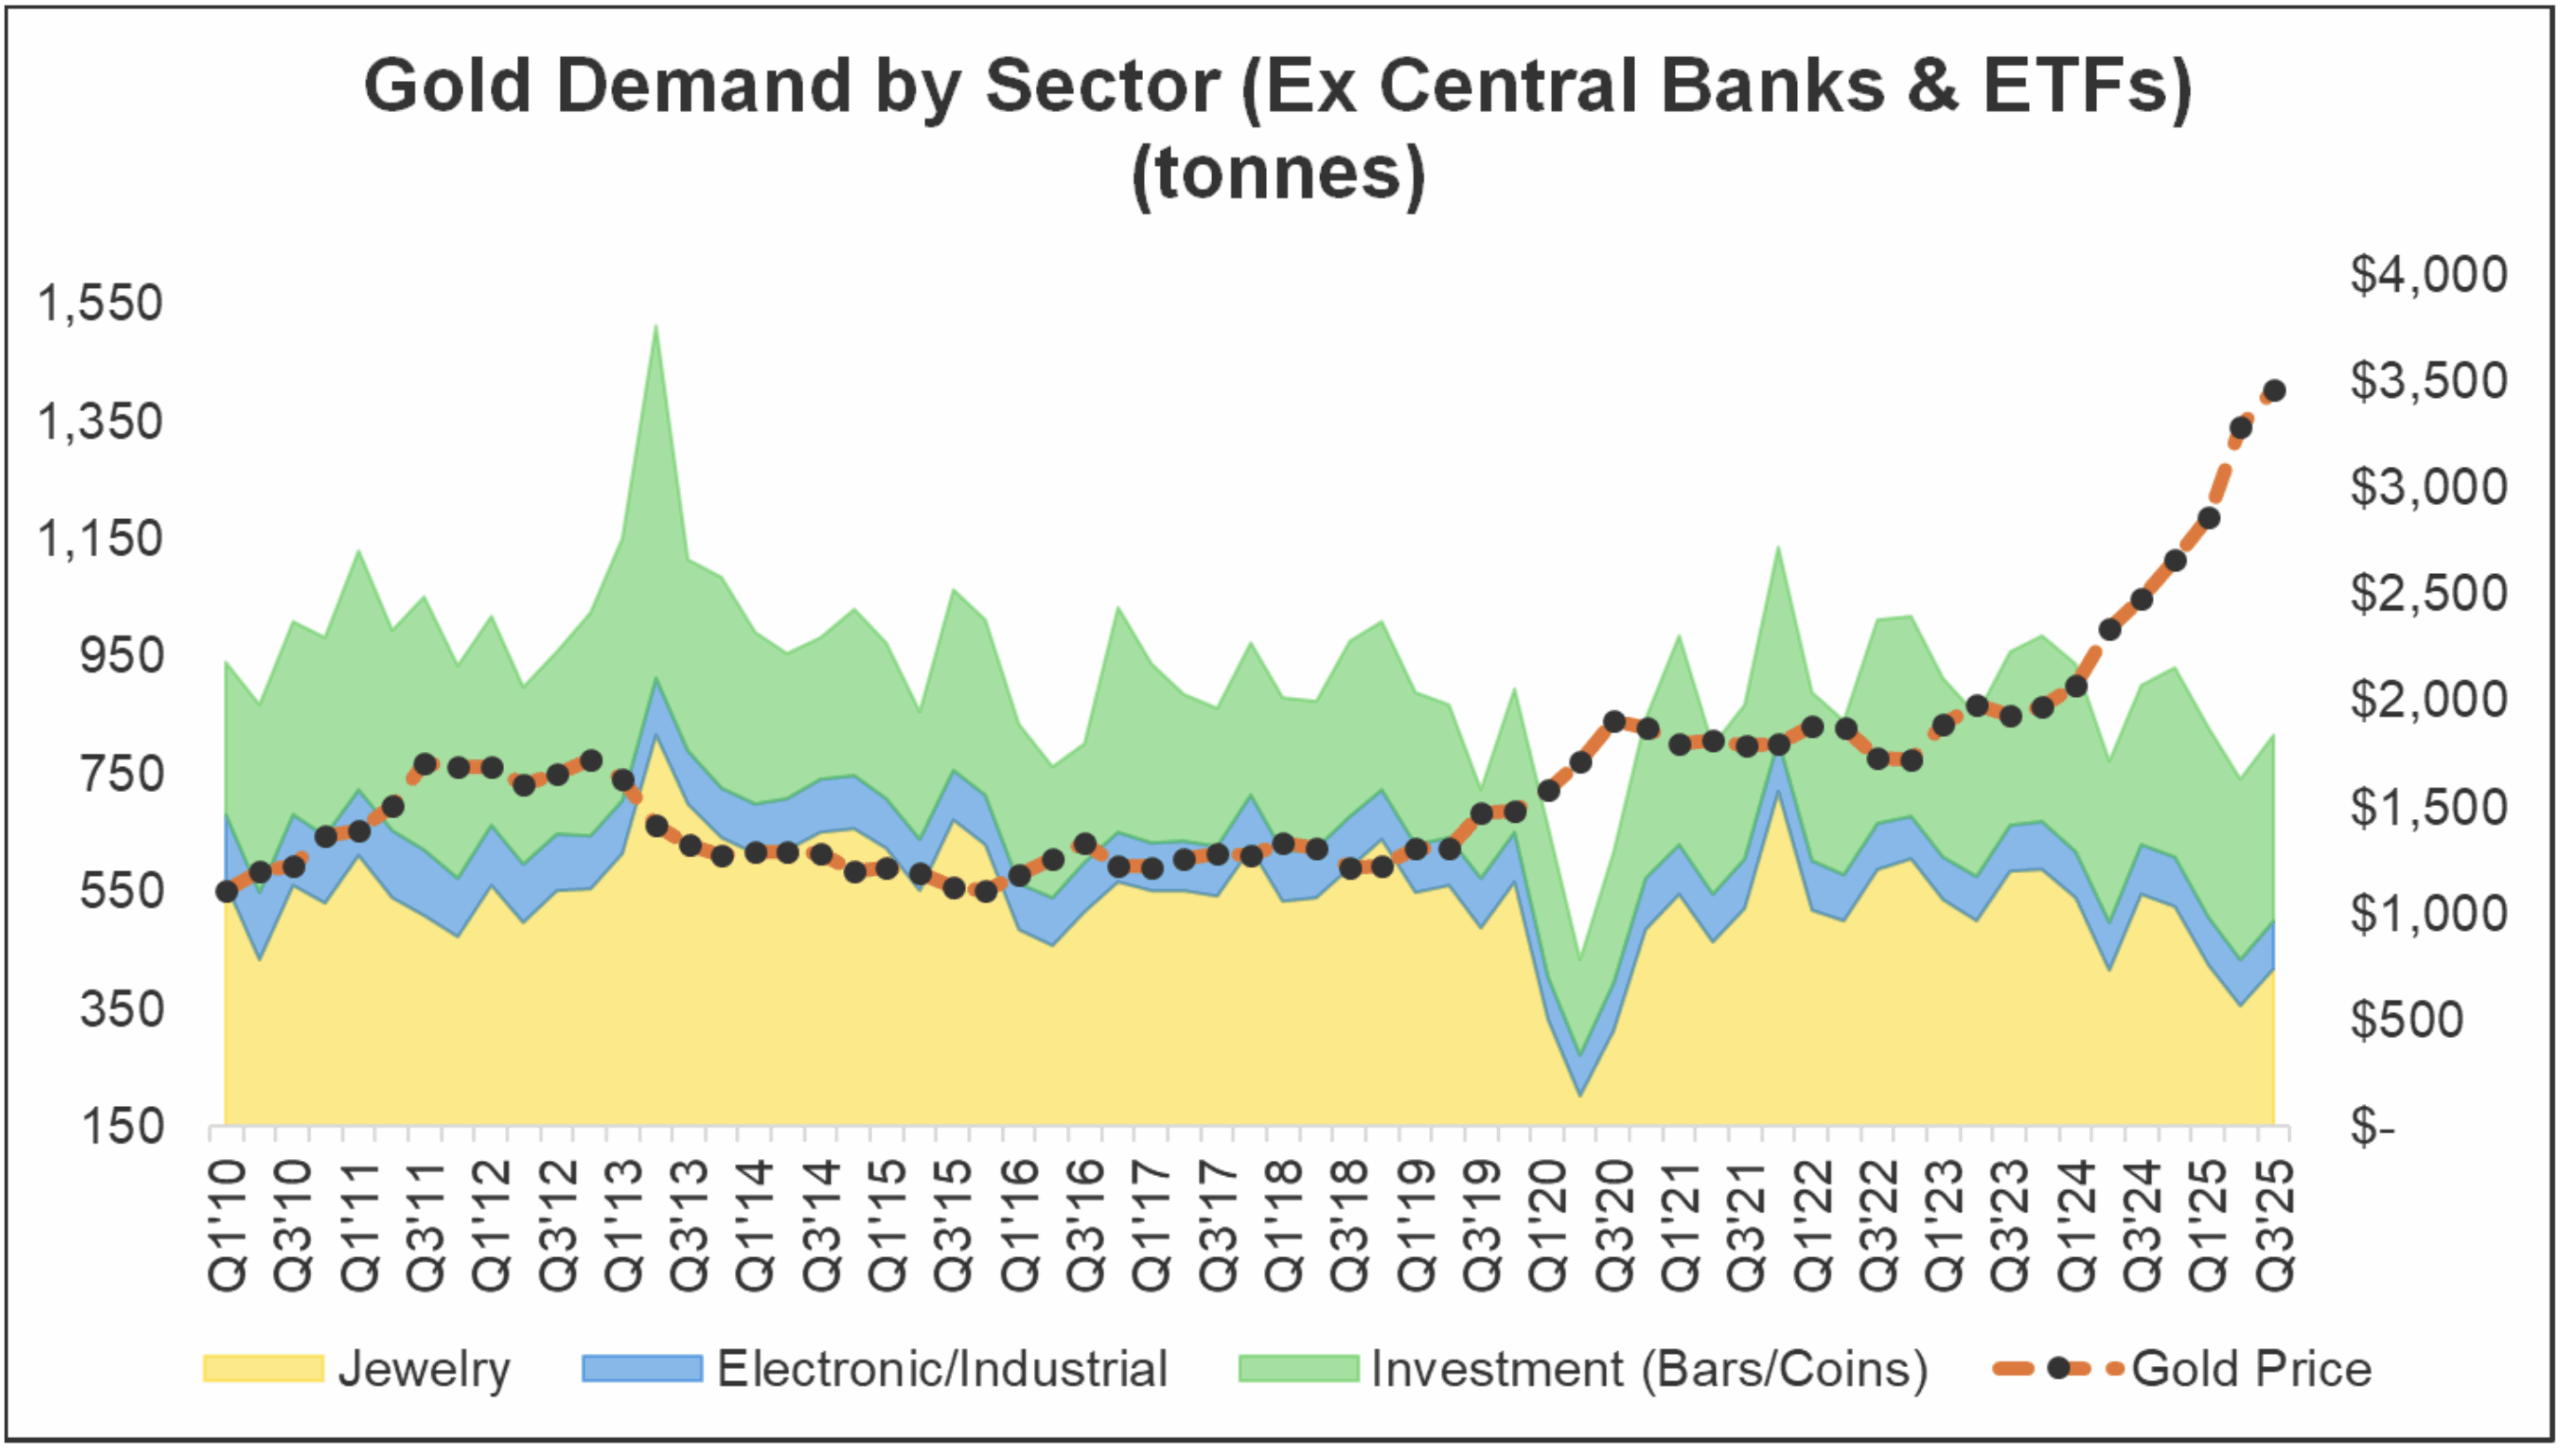
Although central banks have been net buyers of gold since the financial crisis, they still only represent a fraction of the total above ground gold stock and demand.
Most global gold demand comes from other sources. And excluding investment demand from ETFs, this demand has been relatively stable over time apart from a brief demand spike and demand drop in 2013 and 2020 respectively.
Source: World Gold Council
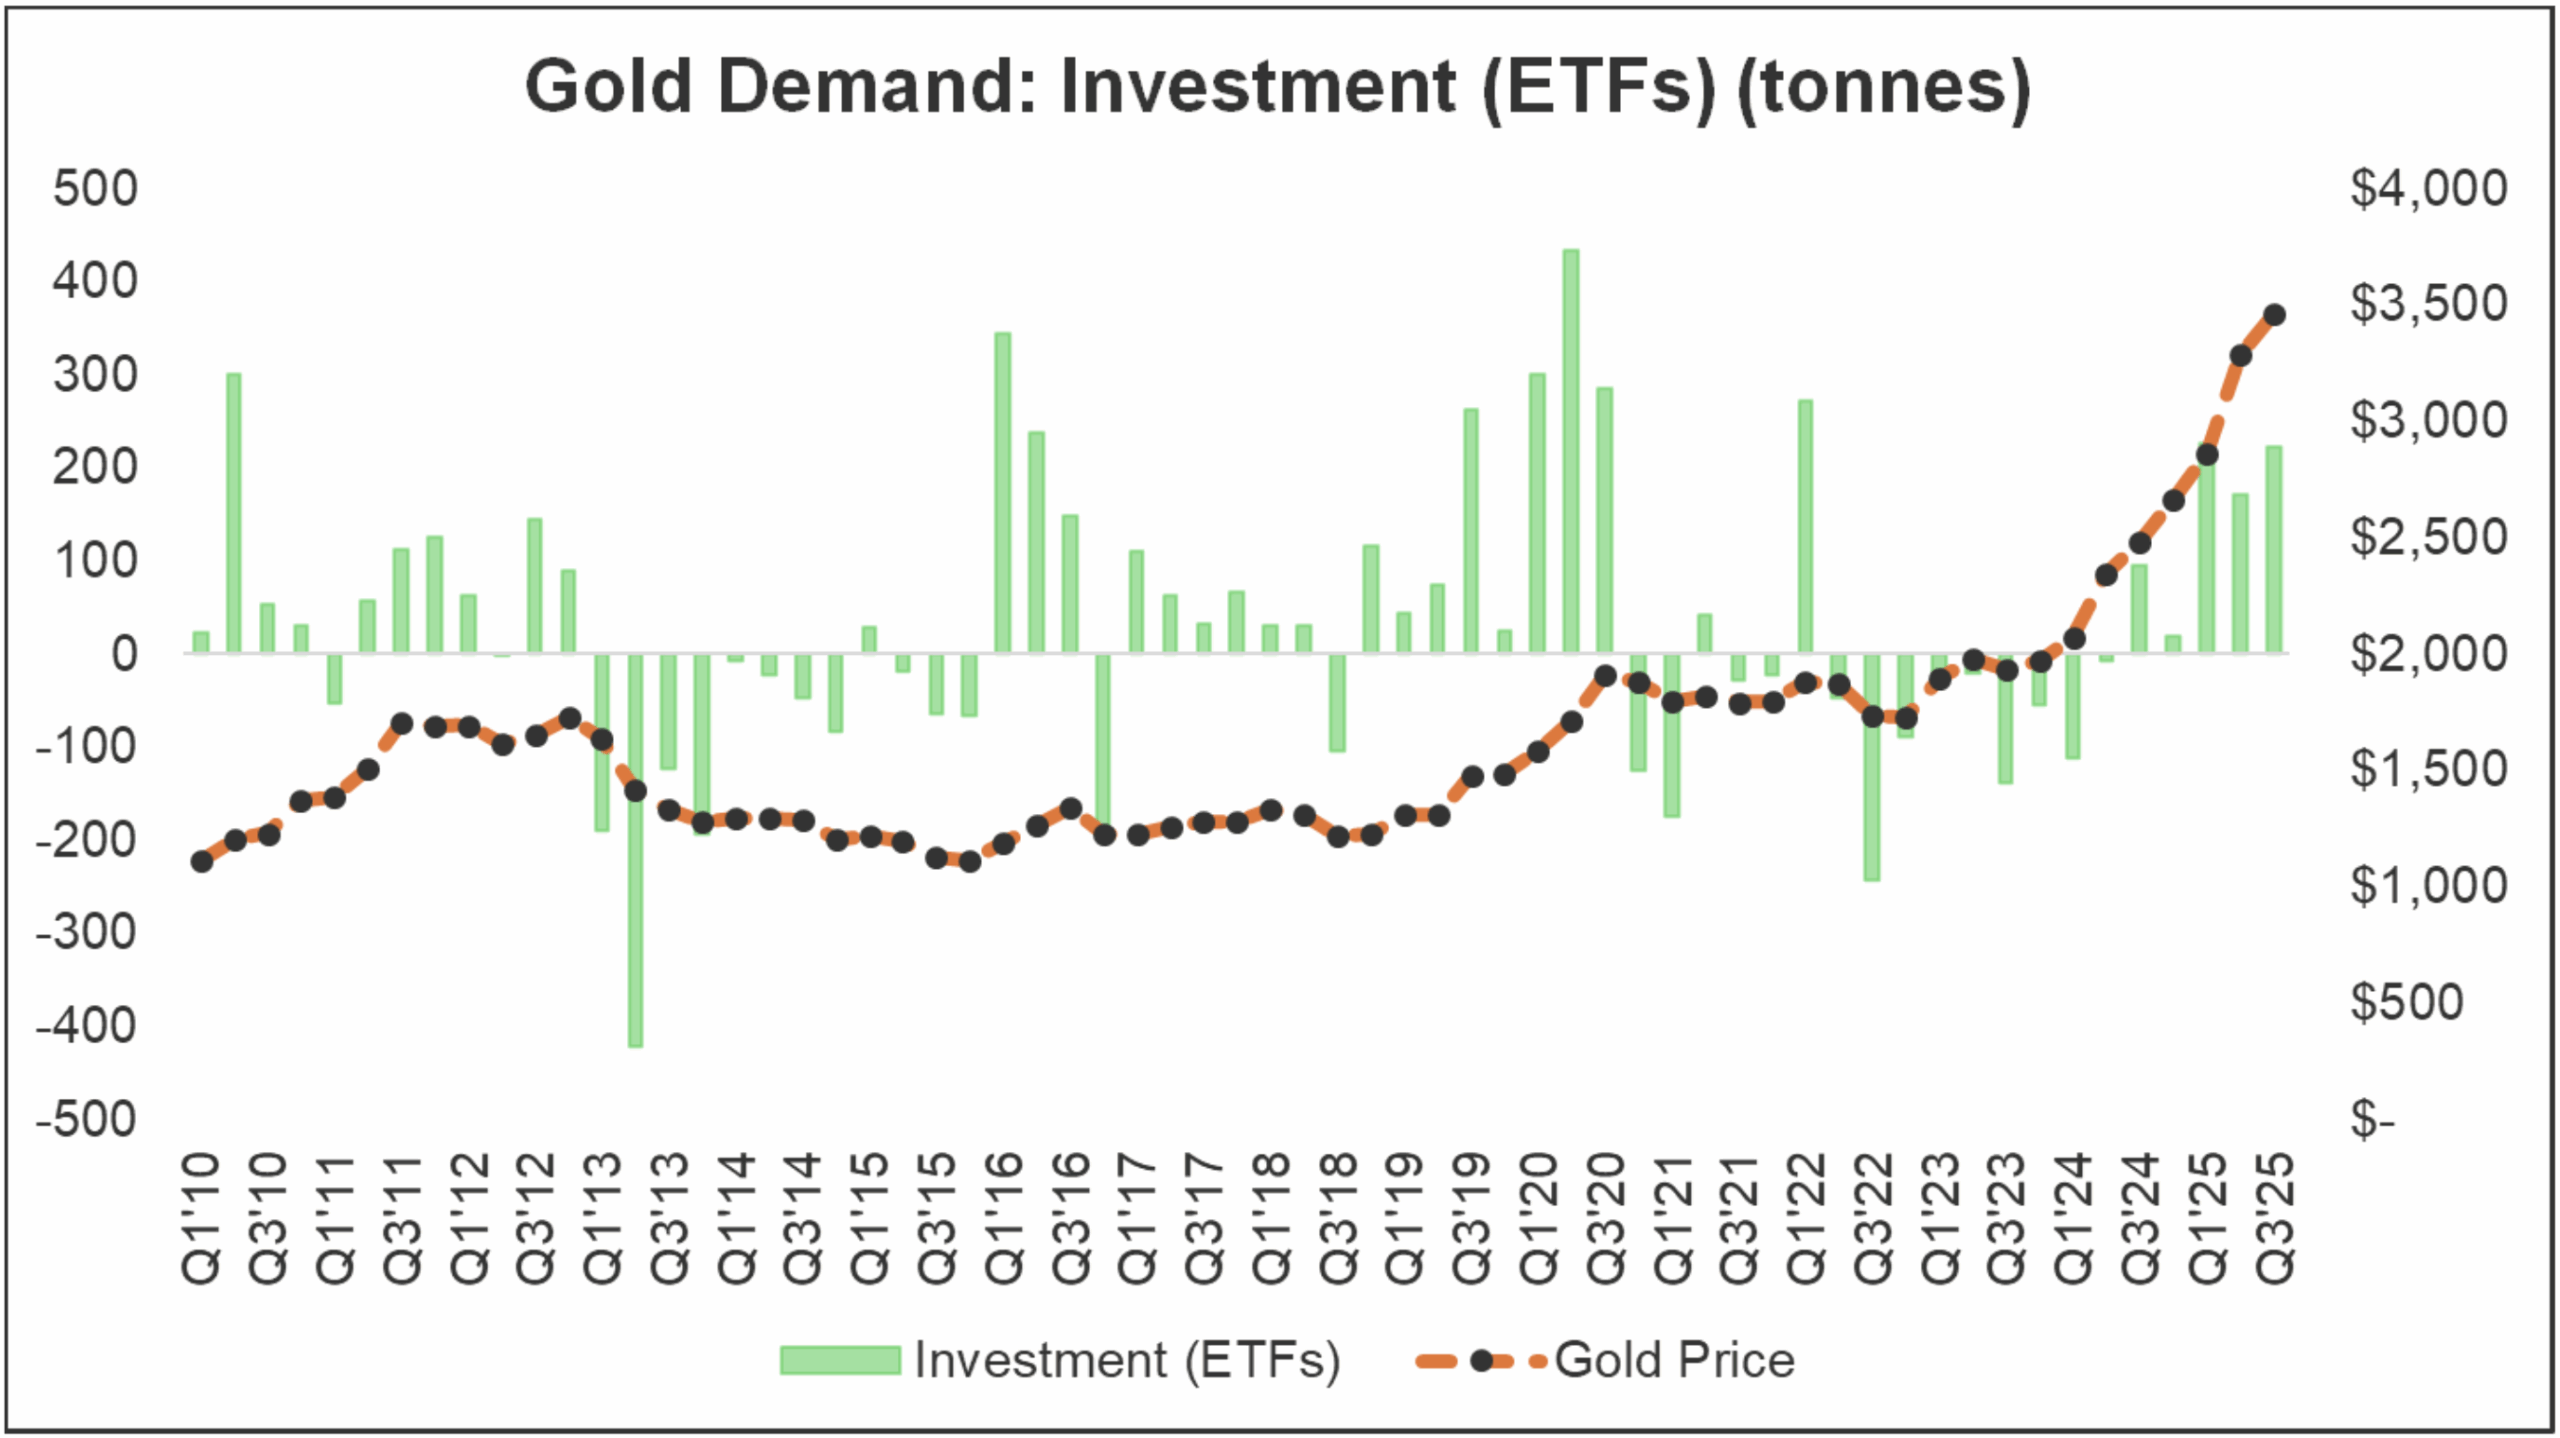
Investment demand from ETFs is the most volatile among all sources of gold demand, with substantial swings from quarter to quarter as both large net purchases and sales occur. This volatility is understandable since gold ETF investors may not always be long-term holders compared to those buying gold for other reasons like jewelry. The ease of purchase and high liquidity of gold ETFs also make it possible for investors to buy and sell quickly. While ETF holdings account for only about 2% of the total above-ground gold stock, ETF demand can represent a significant share of overall gold demand – at times reaching nearly 50%, as seen in Q2 2020. On average, however, the quarterly share of ETF demand aligns with its proportion of the total above-ground gold stock.
Source: World Gold Council
The Drawbacks of Gold
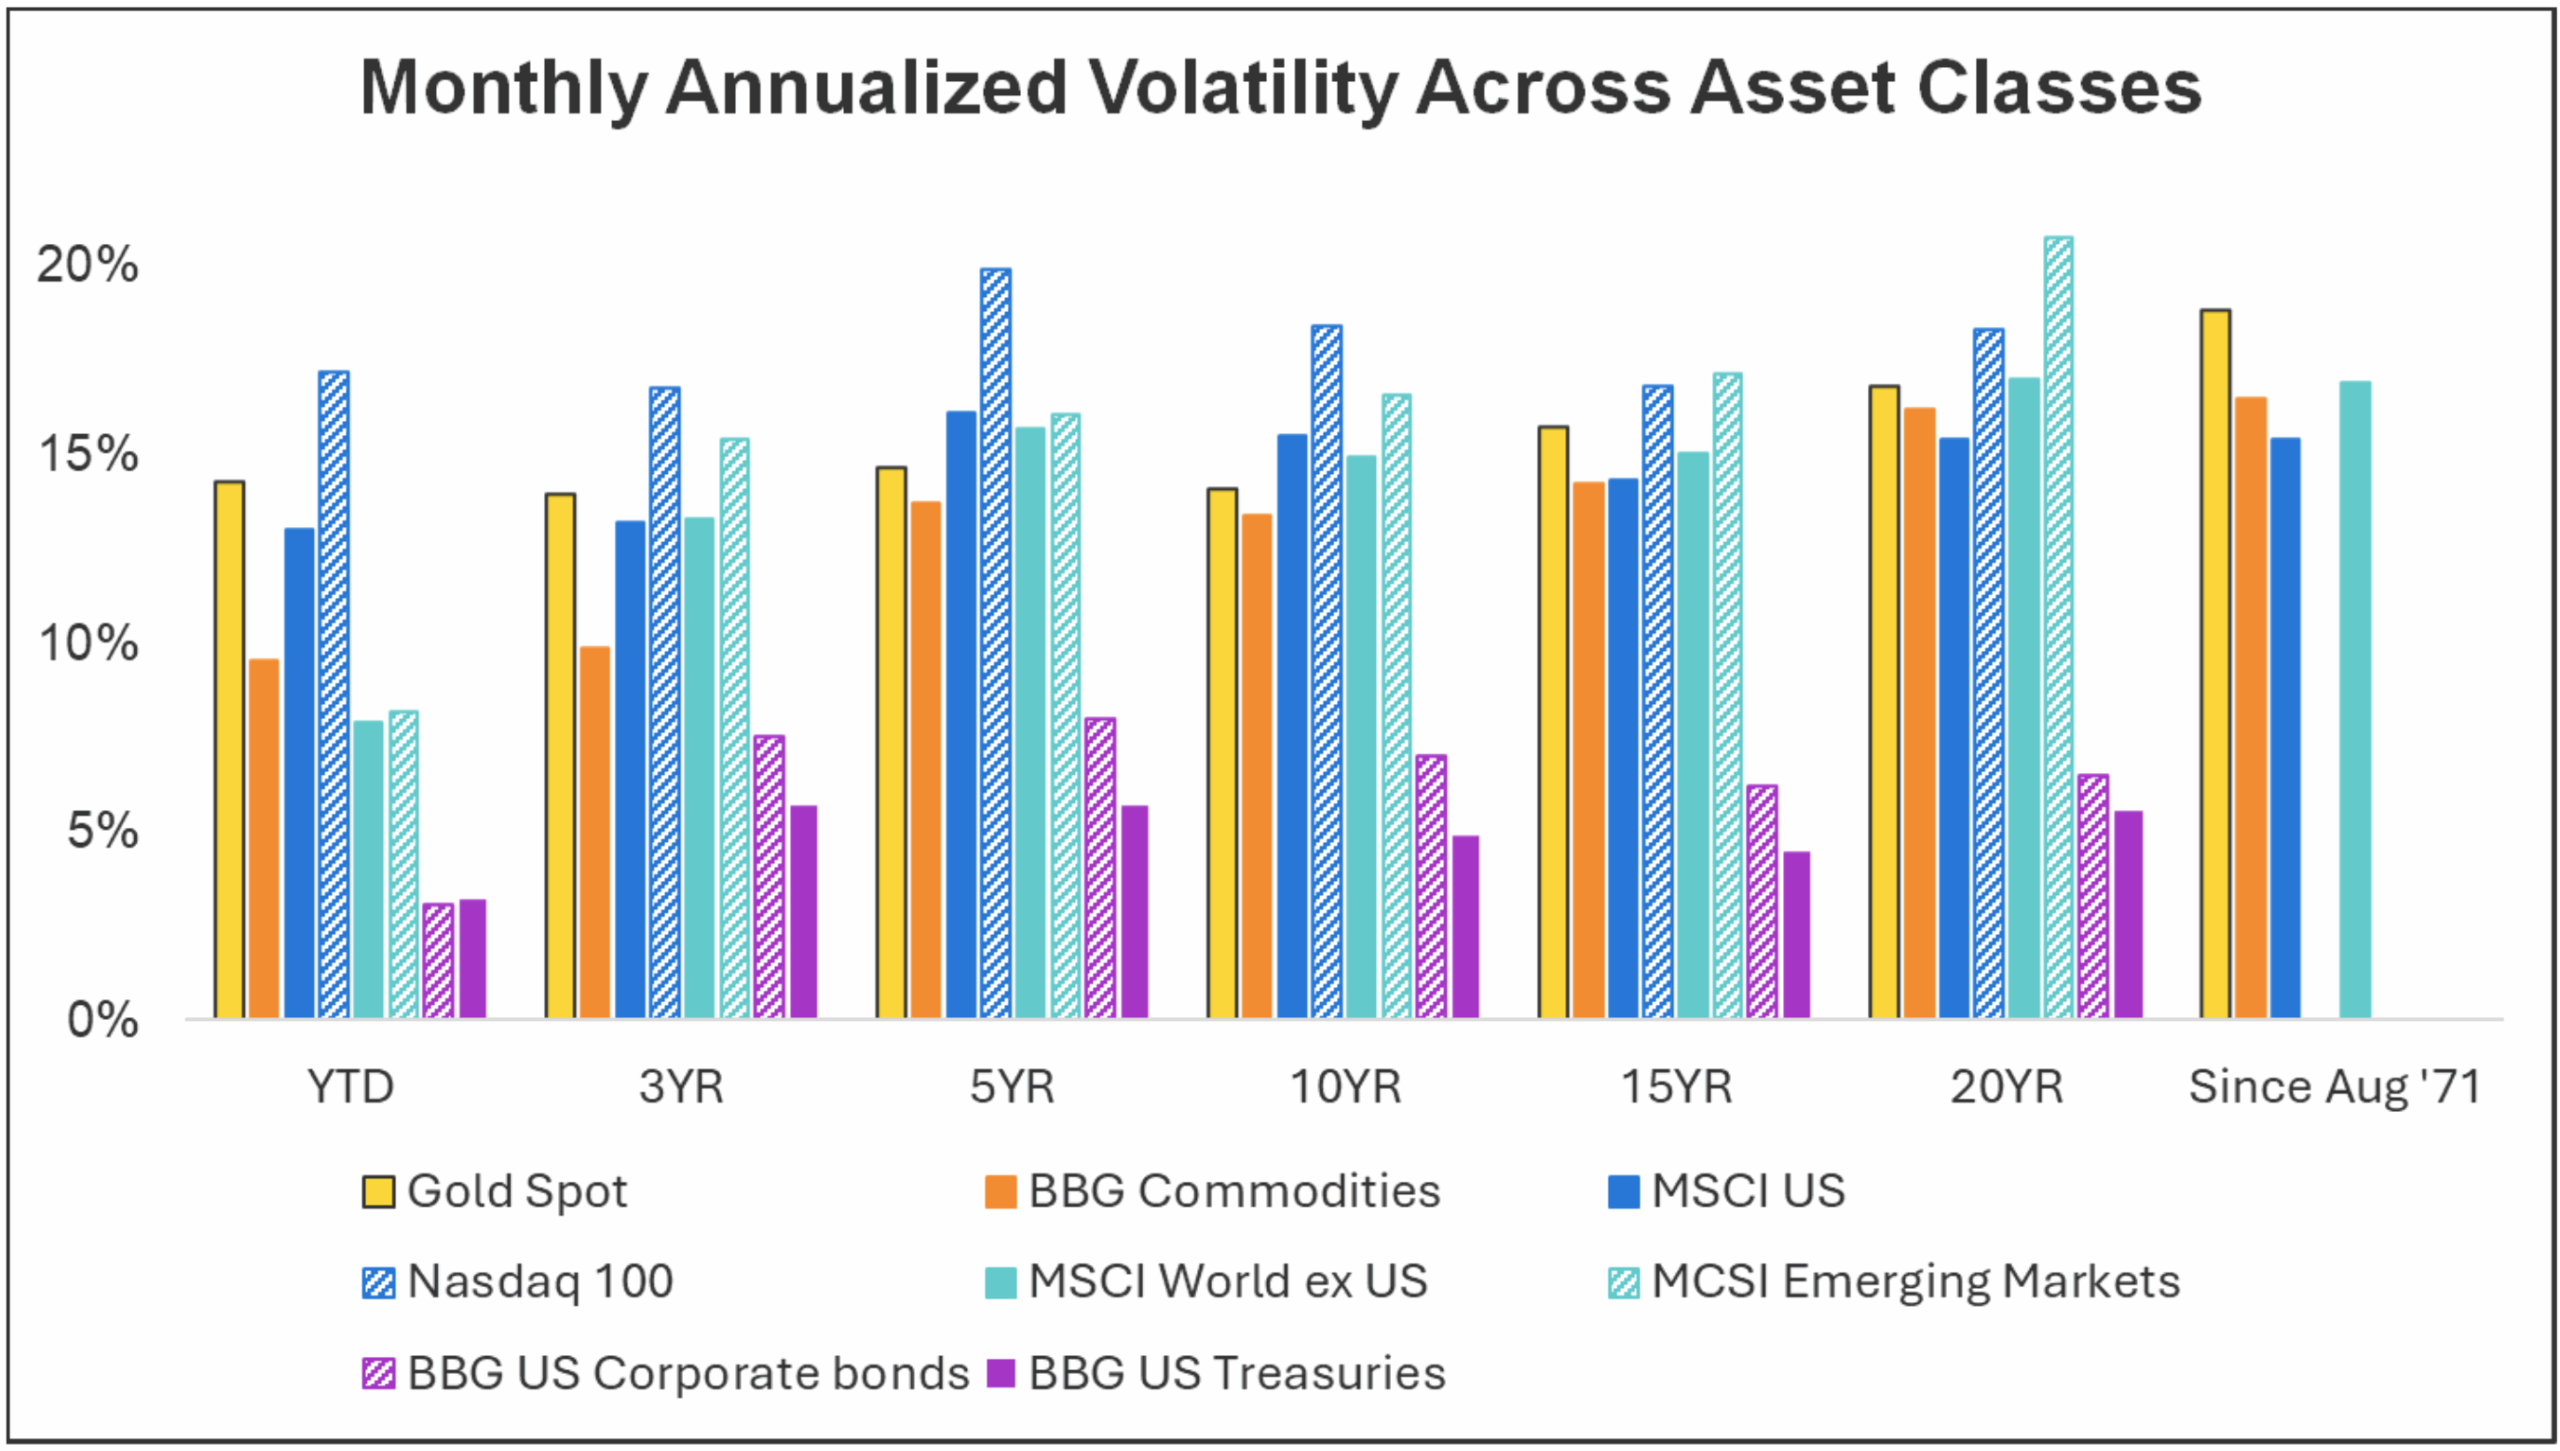
Gold has exhibited price volatility over various time periods, and this can be seen by analyzing its monthly annualized volatility. This statistic is a measure of risk and shows how much an asset’s price fluctuates based on its monthly price changes. Year-to-date, gold’s volatility is lower than tech stocks, but higher than many other asset classes. Over longer periods, U.S. and international stocks have been both more and less volatile than gold, while emerging markets and tech stocks have been more volatile. Bonds, both U.S. corporates and U.S. Treasuries have historically been less volatile.
Source: World Gold Council
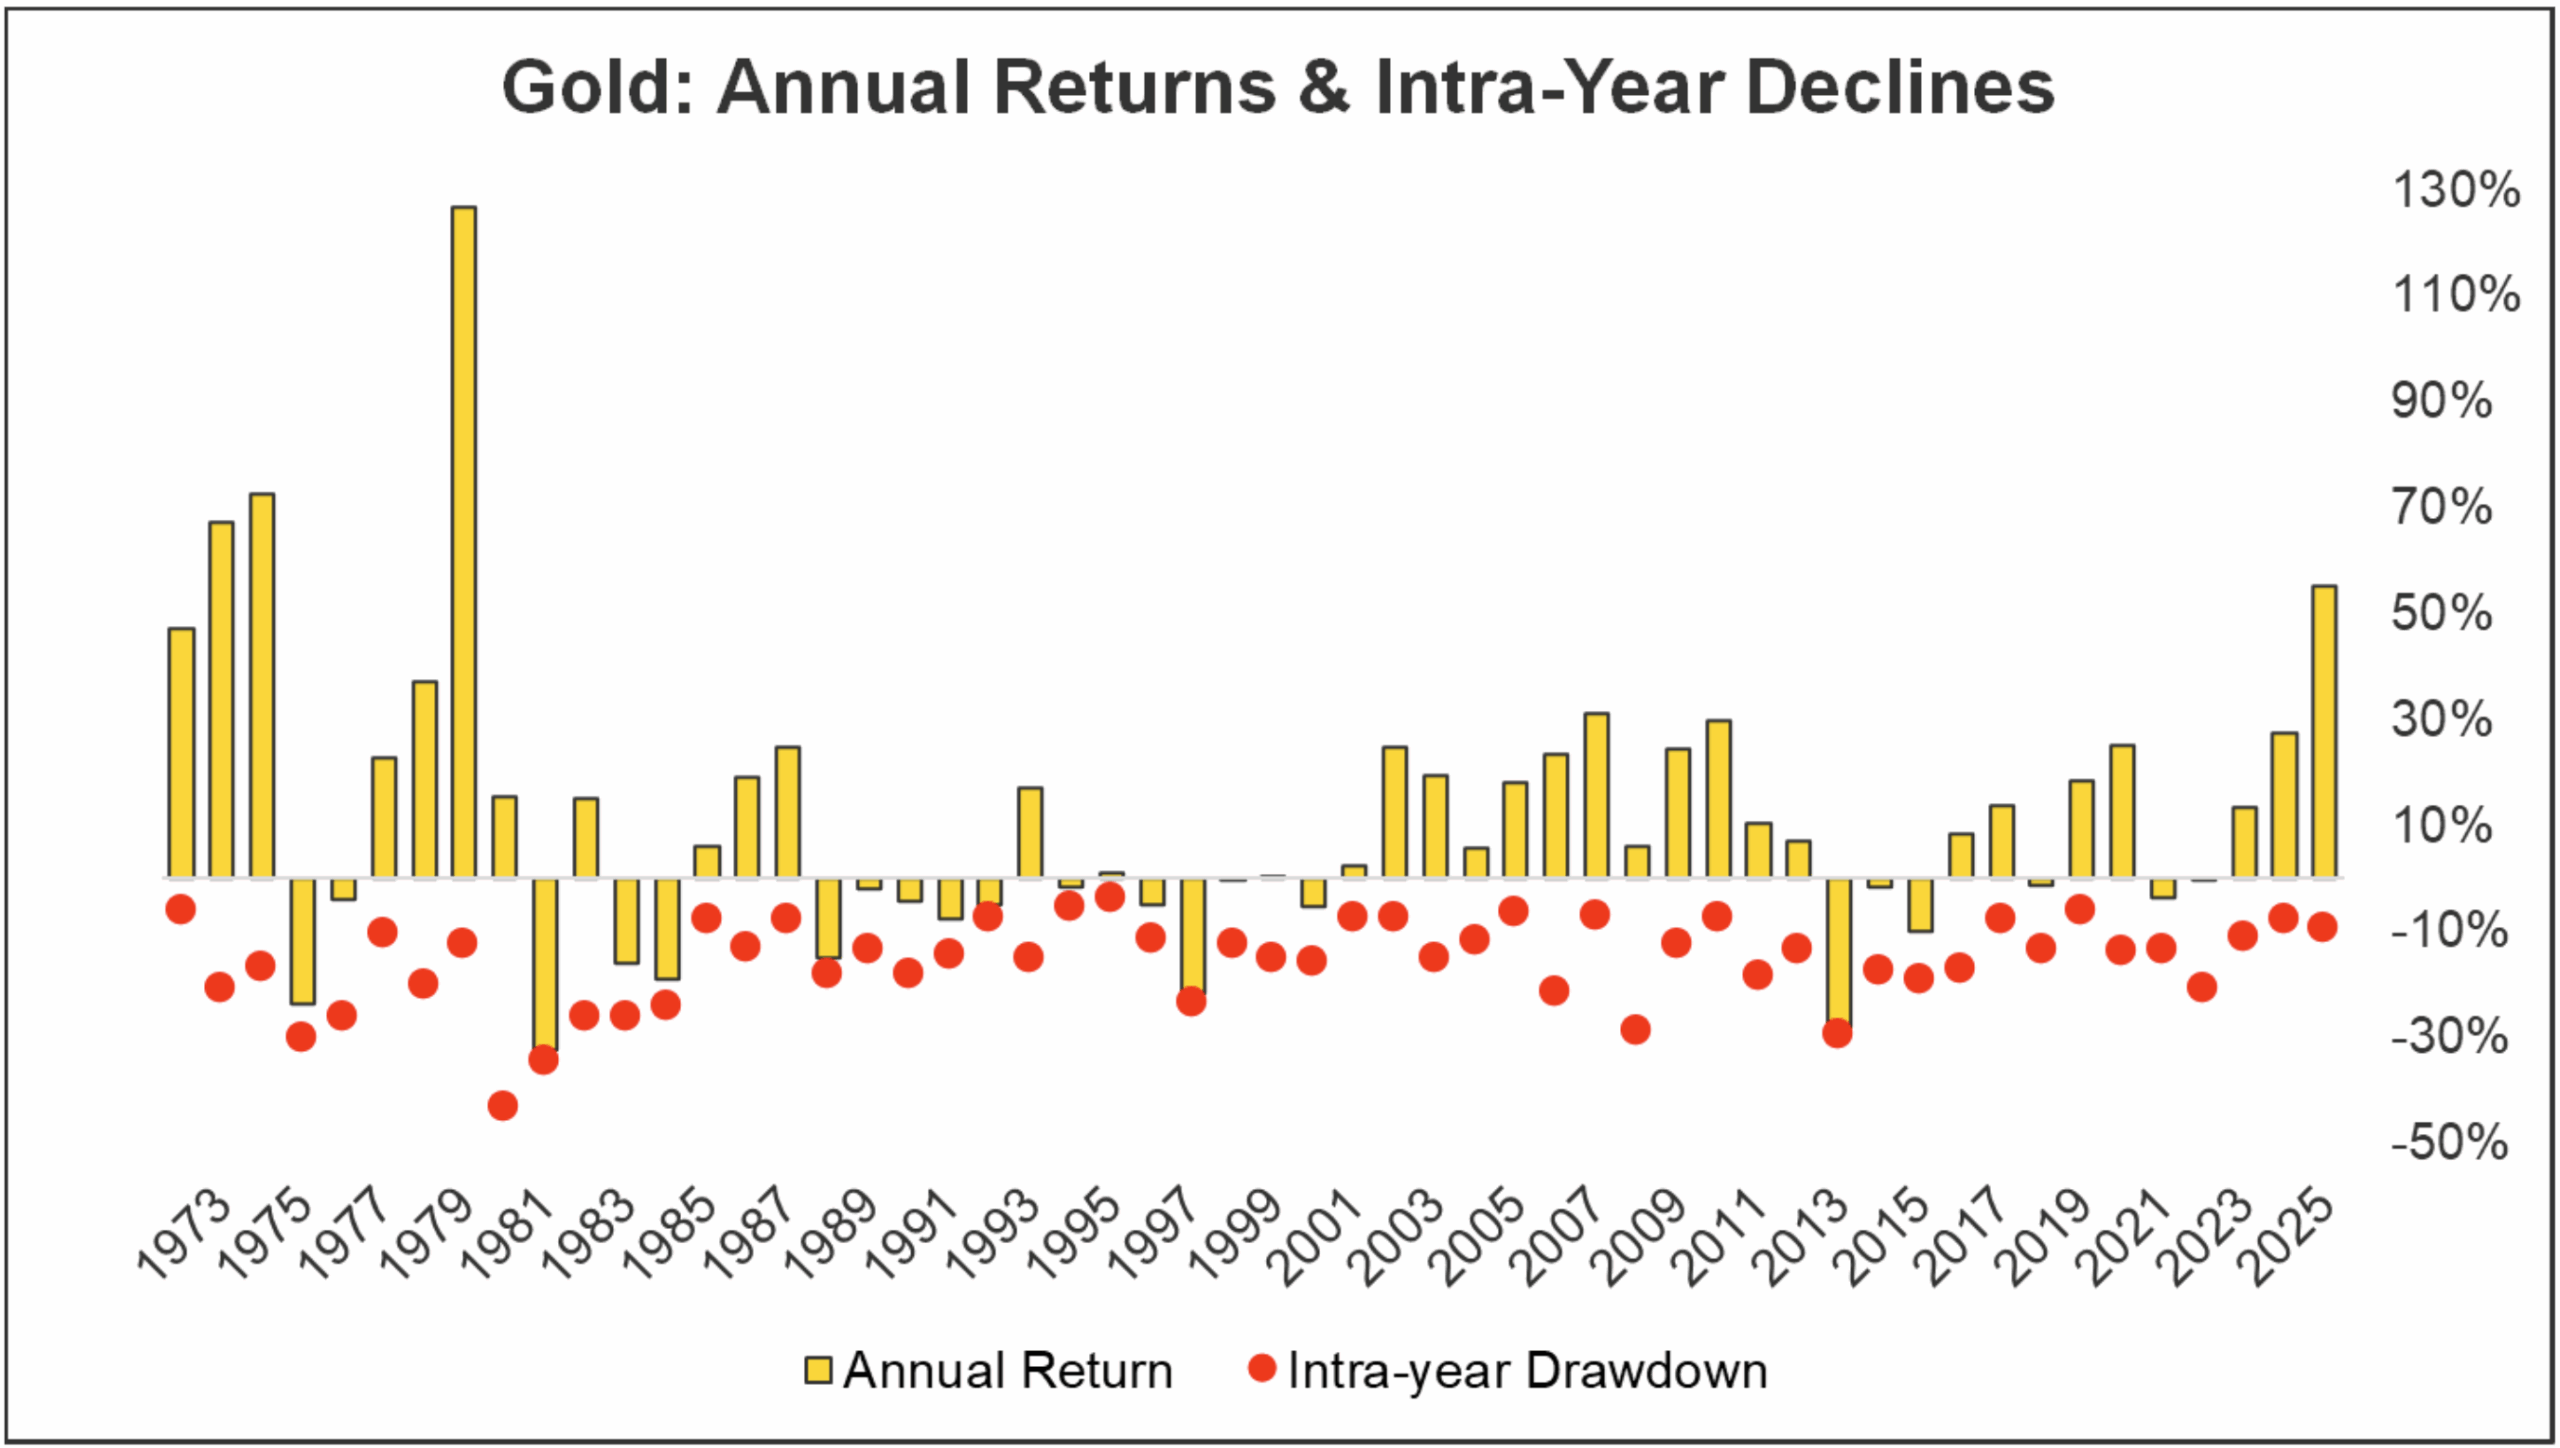
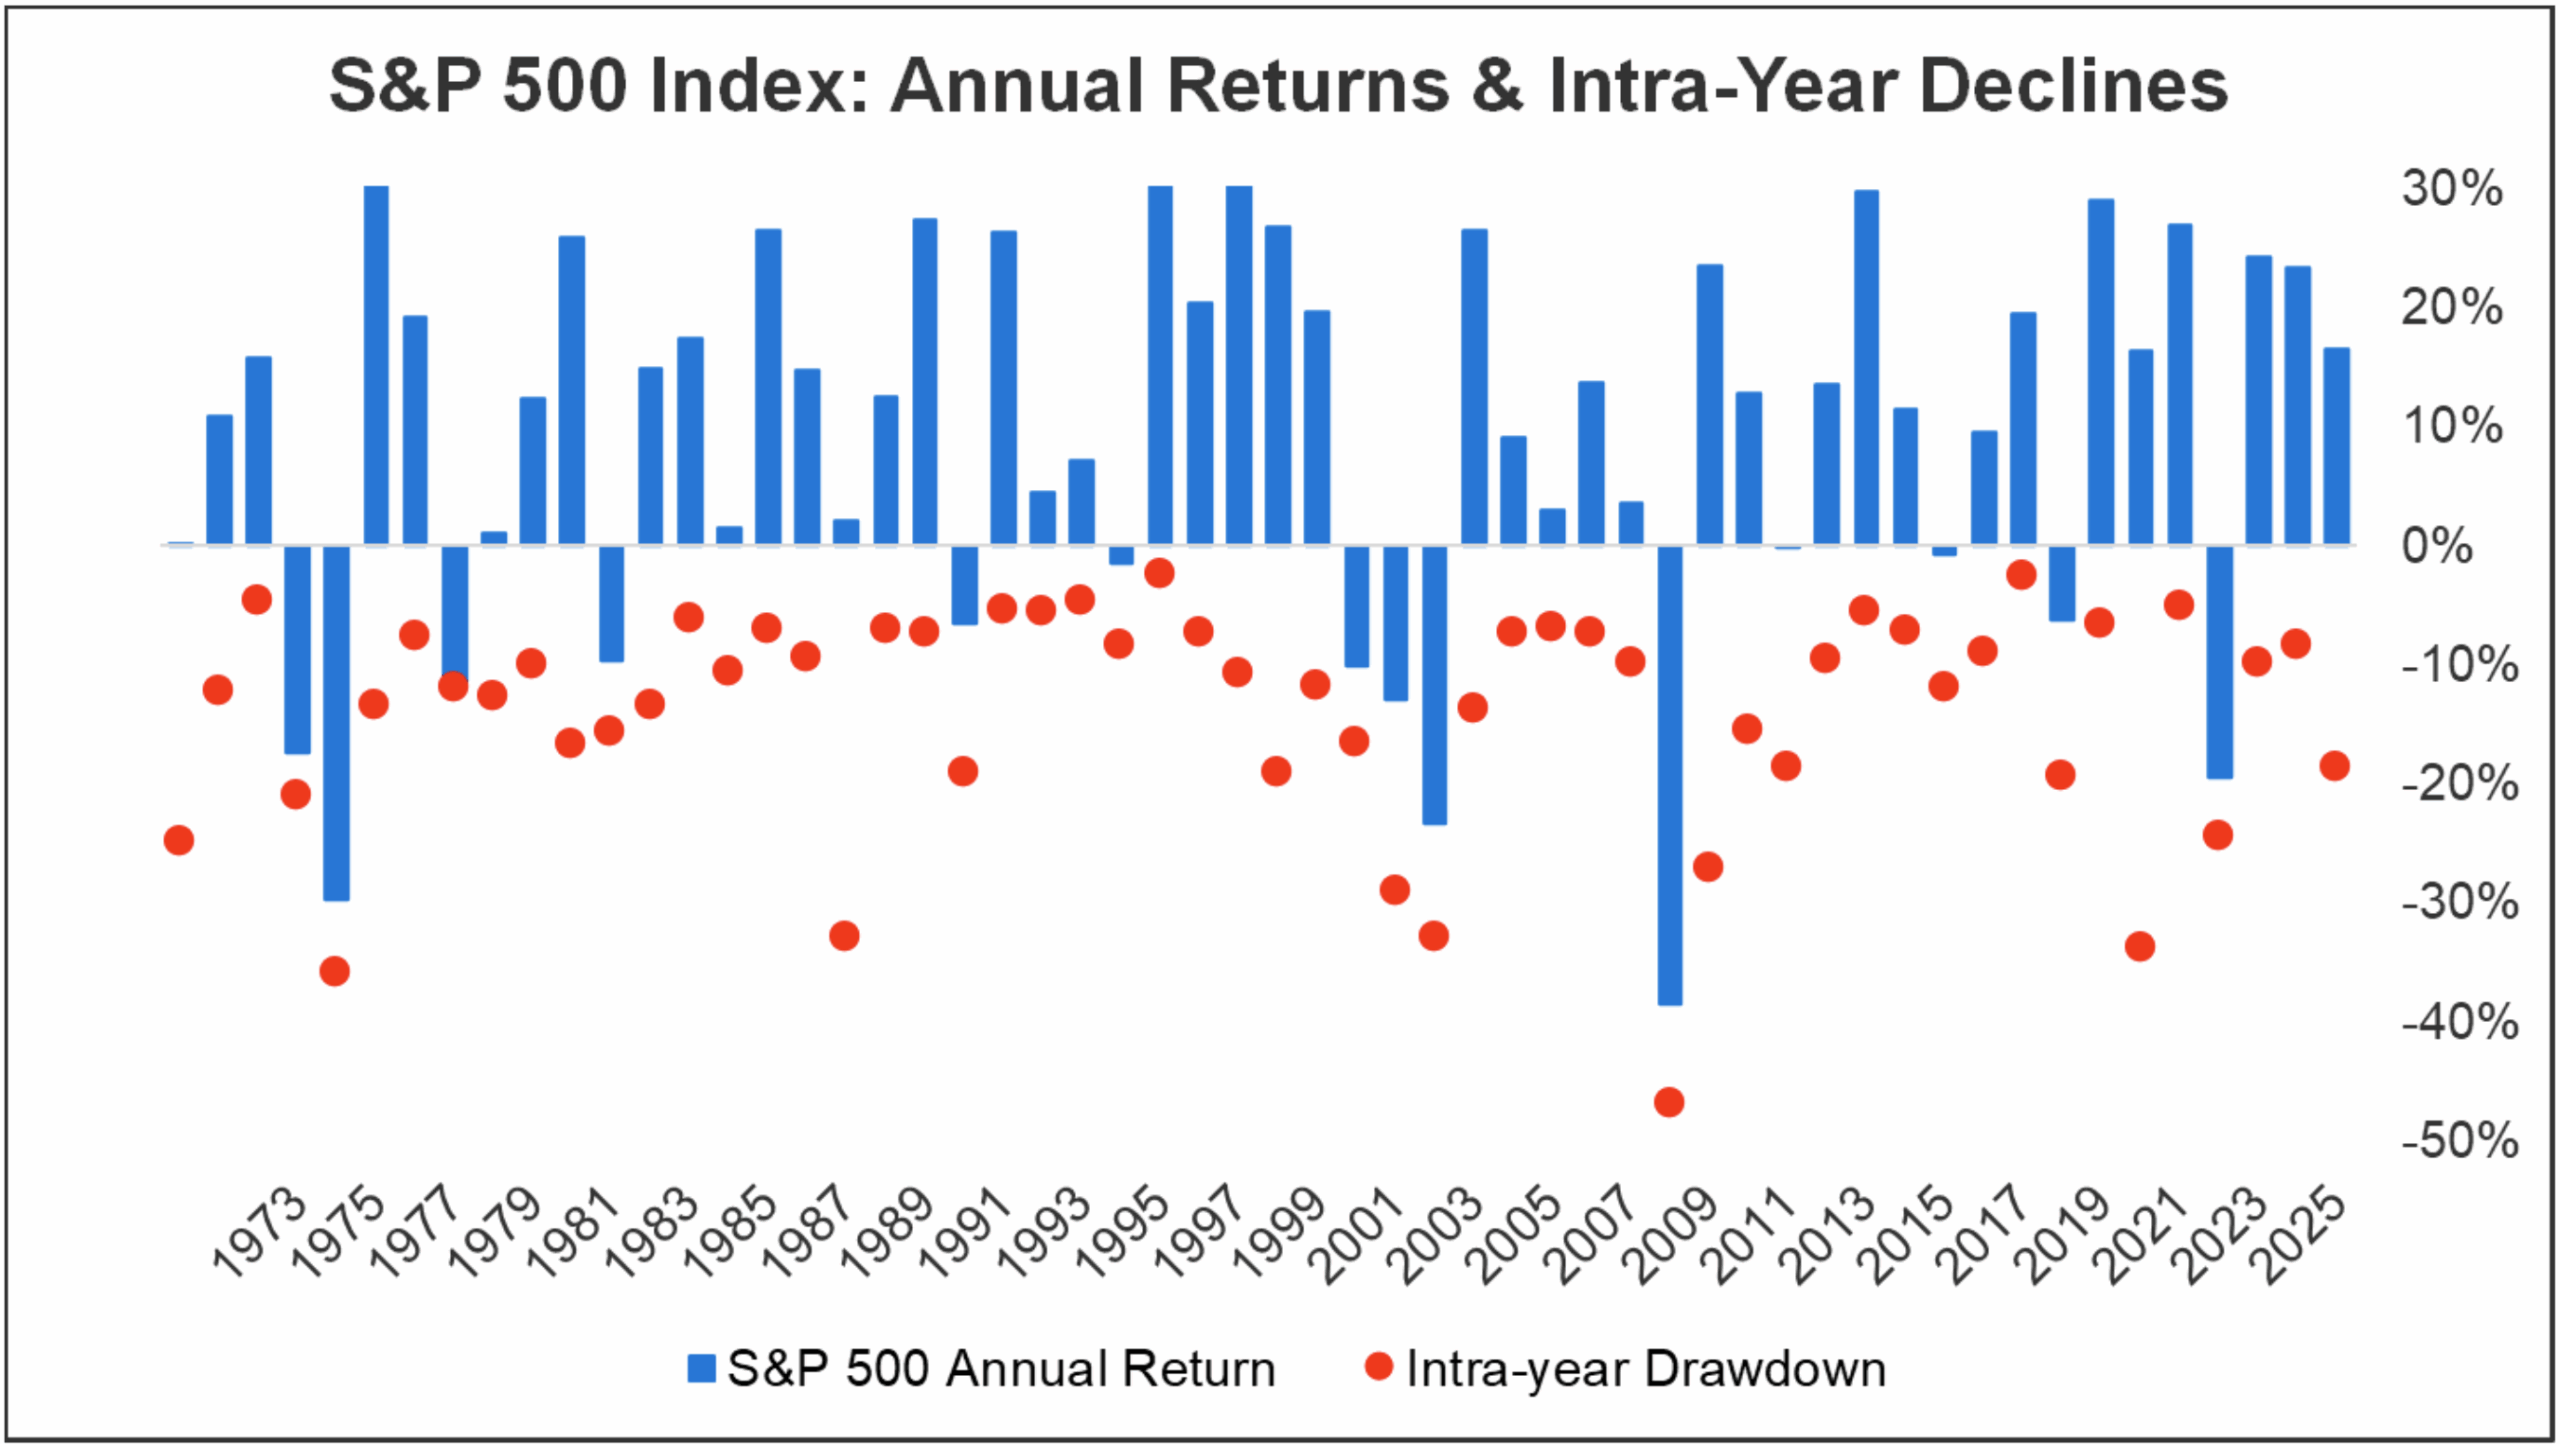
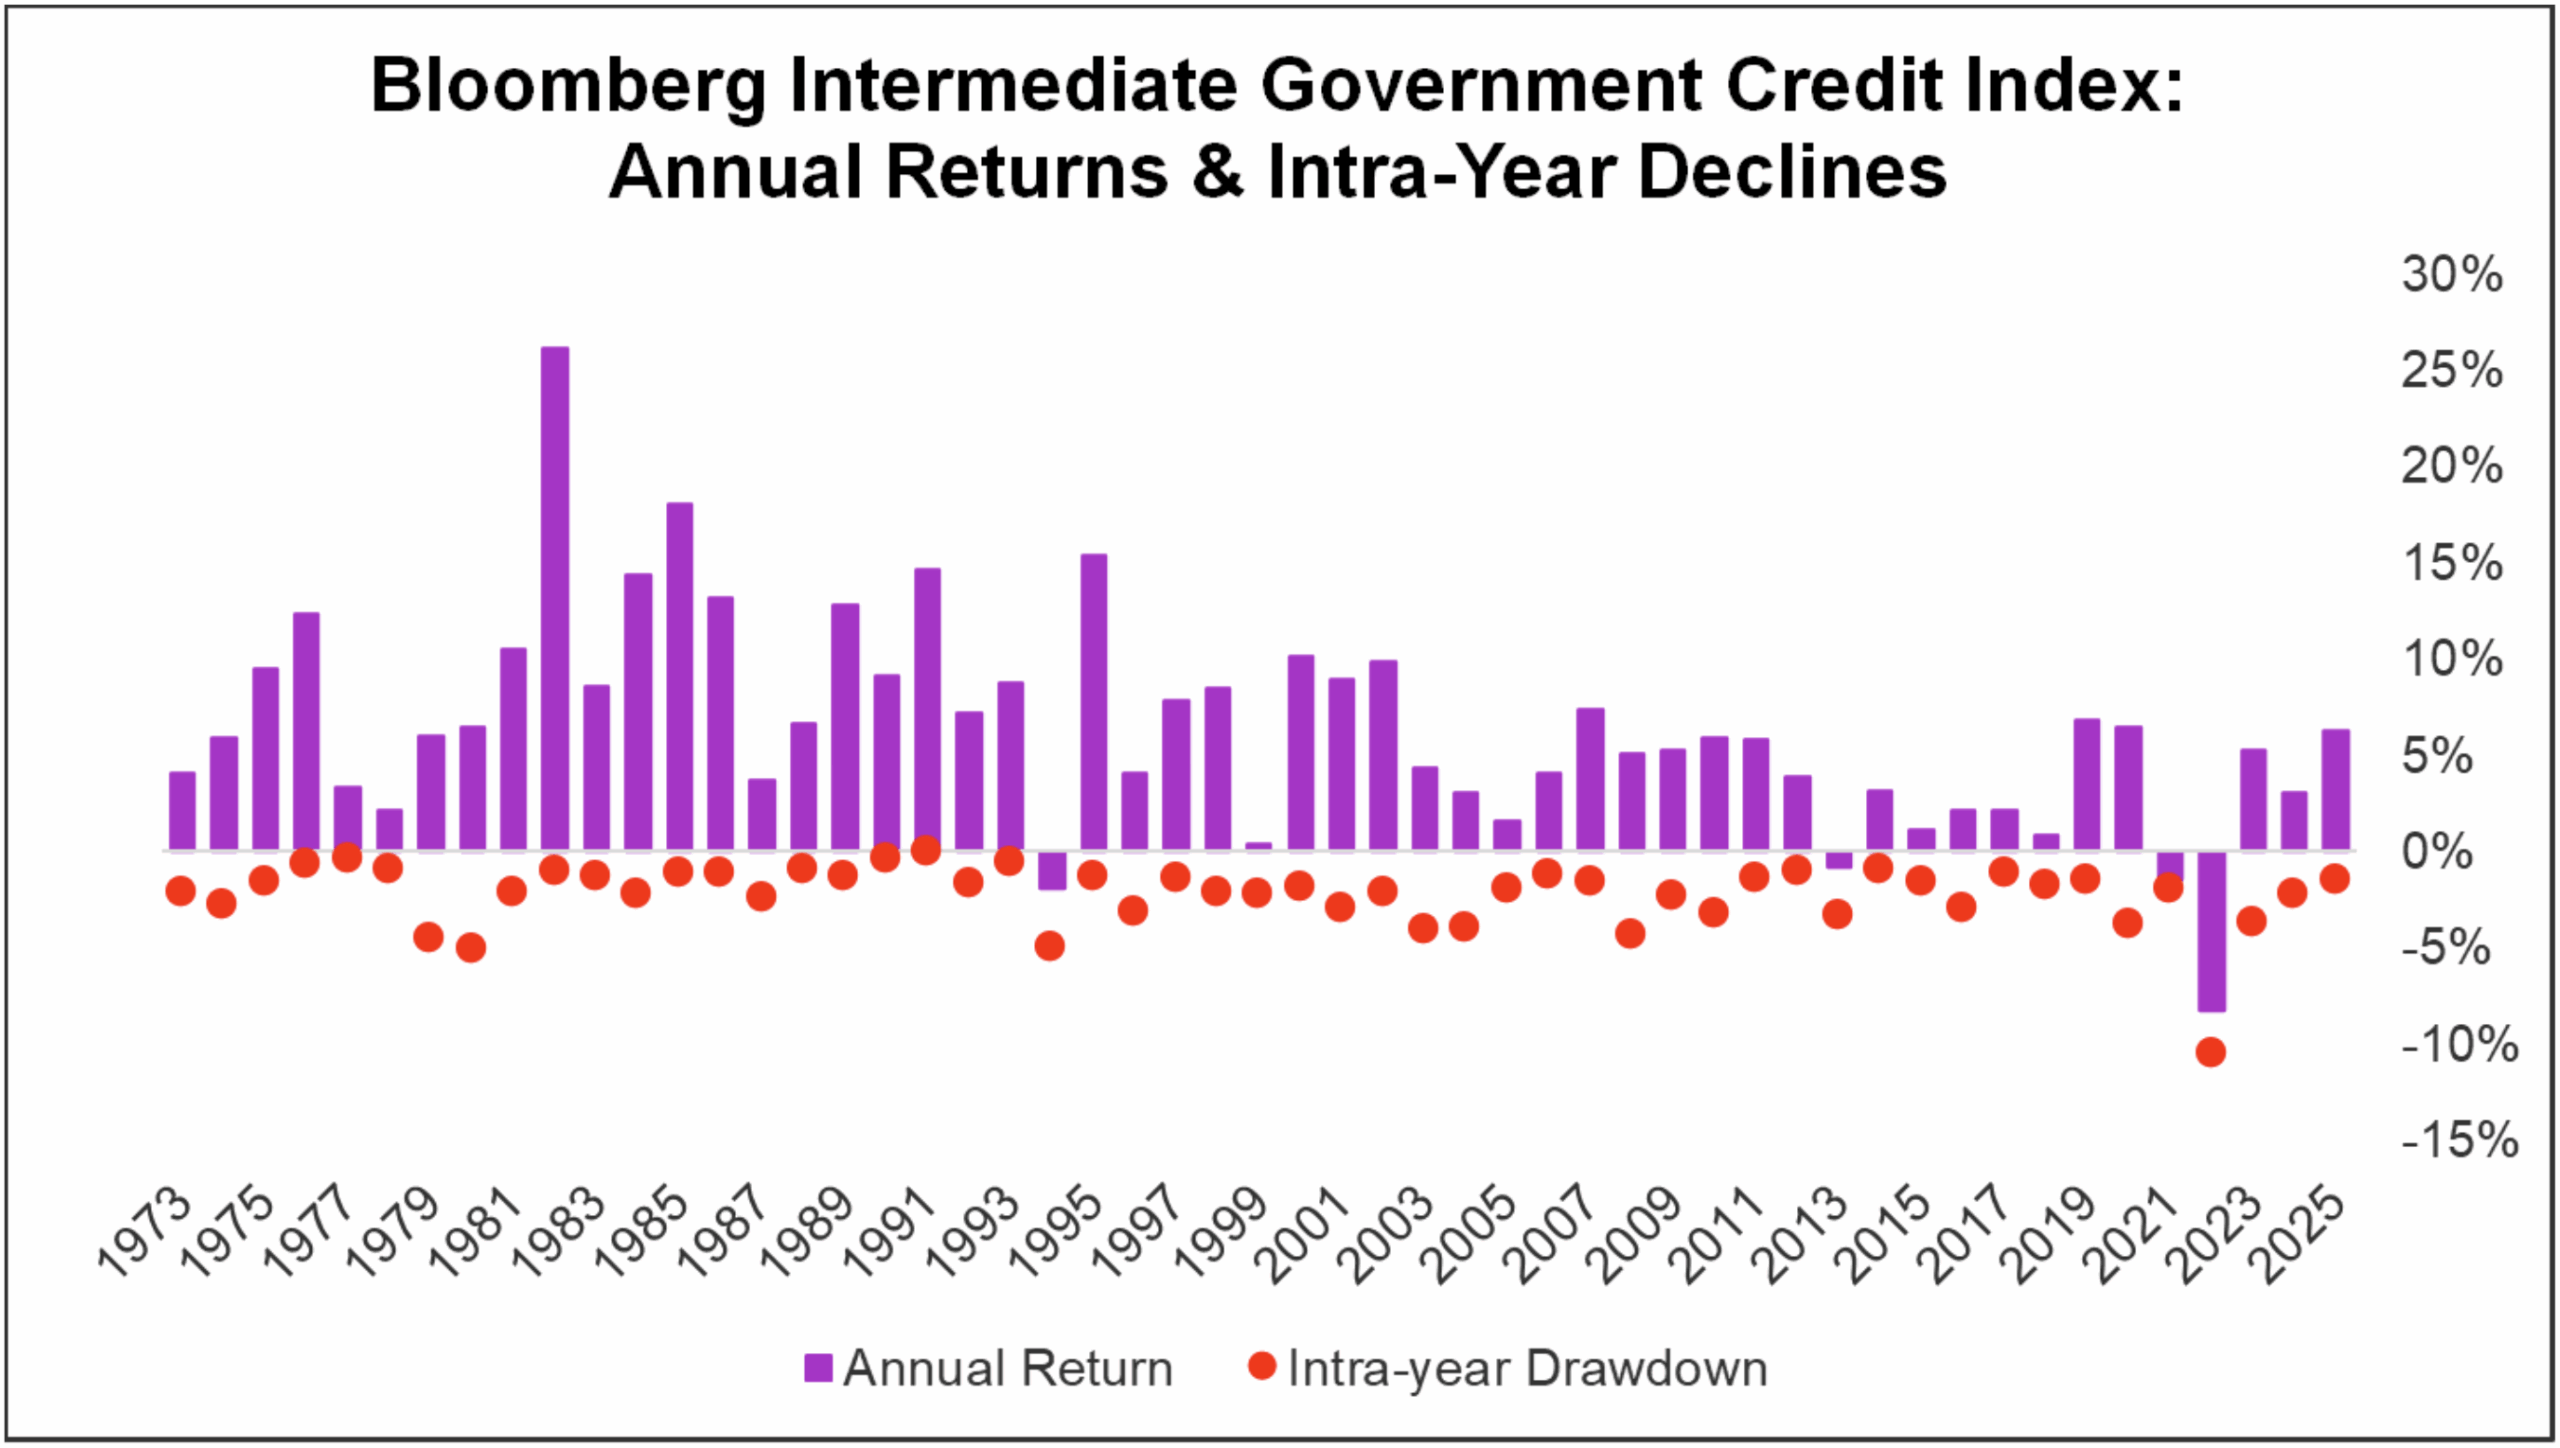
An additional way to visualize gold’s risk profile is to compare the annual returns and maximum annual drawdowns (intra-year declines) of gold, stocks, and bonds. Since 1970, gold has experienced intra-year declines greater than 20% in 36% of all years – more frequent than the 33% experienced by the S&P 500. By contrast, the Bloomberg Intermediate Government Credit Index, a widely used bond benchmark, has never experienced an intra-year decline exceeding 10.5%, and that only happened once, in 2022.
Source: Bloomberg
Source: Bloomberg
Source: Bloomberg
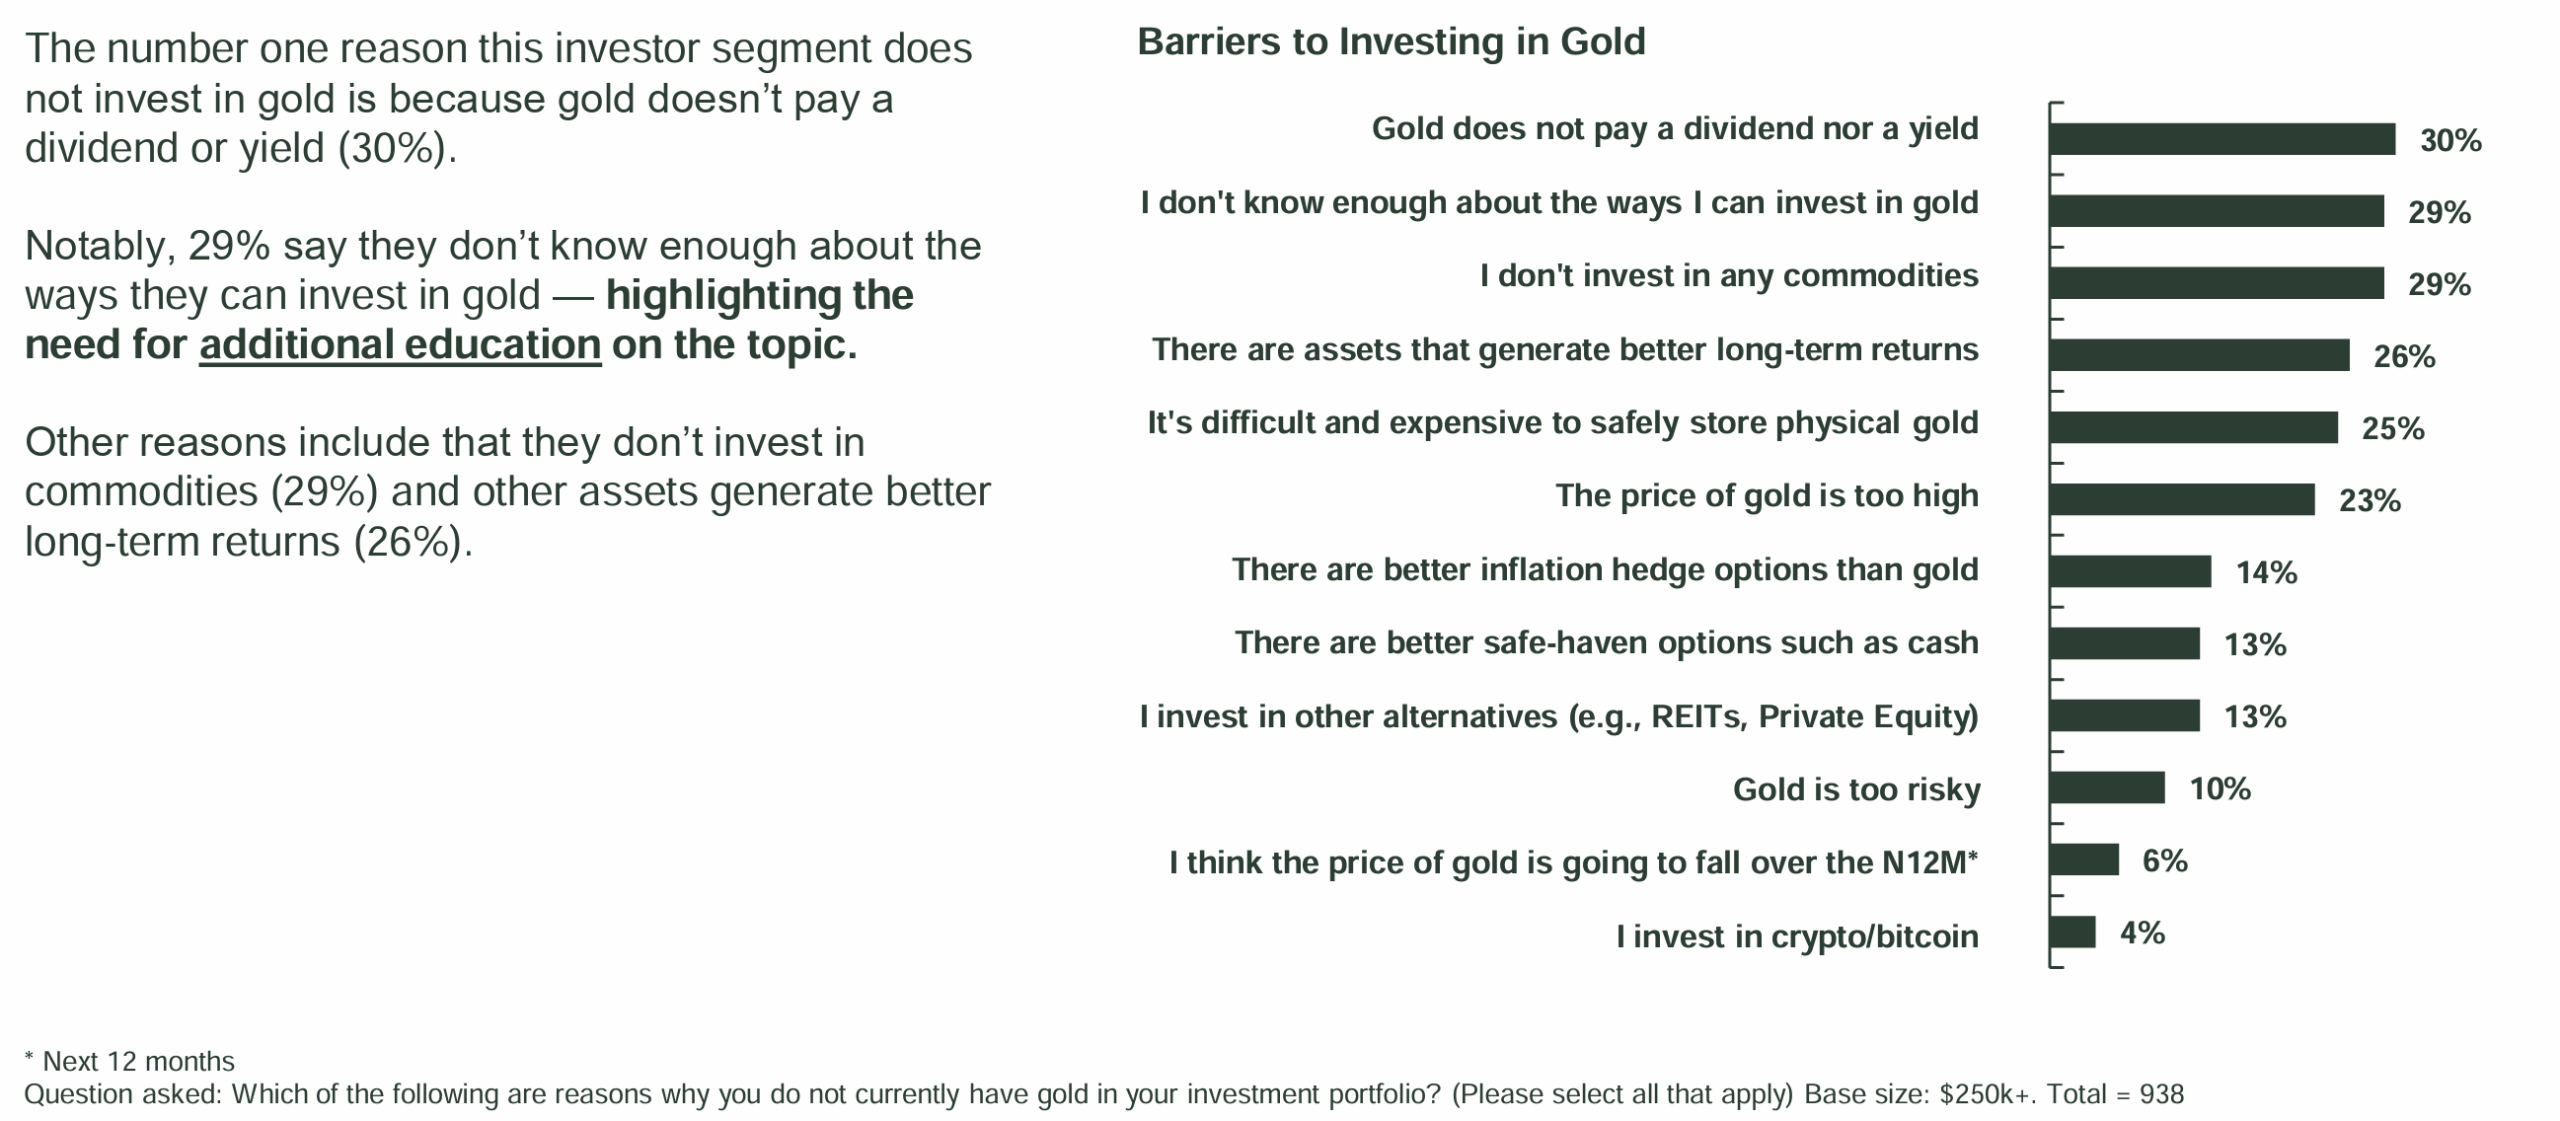
Another drawback is that gold does not pay dividends or generate a yield or cashflow, making it harder to value in the same traditional ways one would value a stock. According to a 2024 State Street Global Advisors survey, the lack of a dividend was the top reason stopping high-net-worth investors from owning gold.
What Stops Investors From Going for Gold?
Source: State Street Global Advisors
The Benefits of Gold
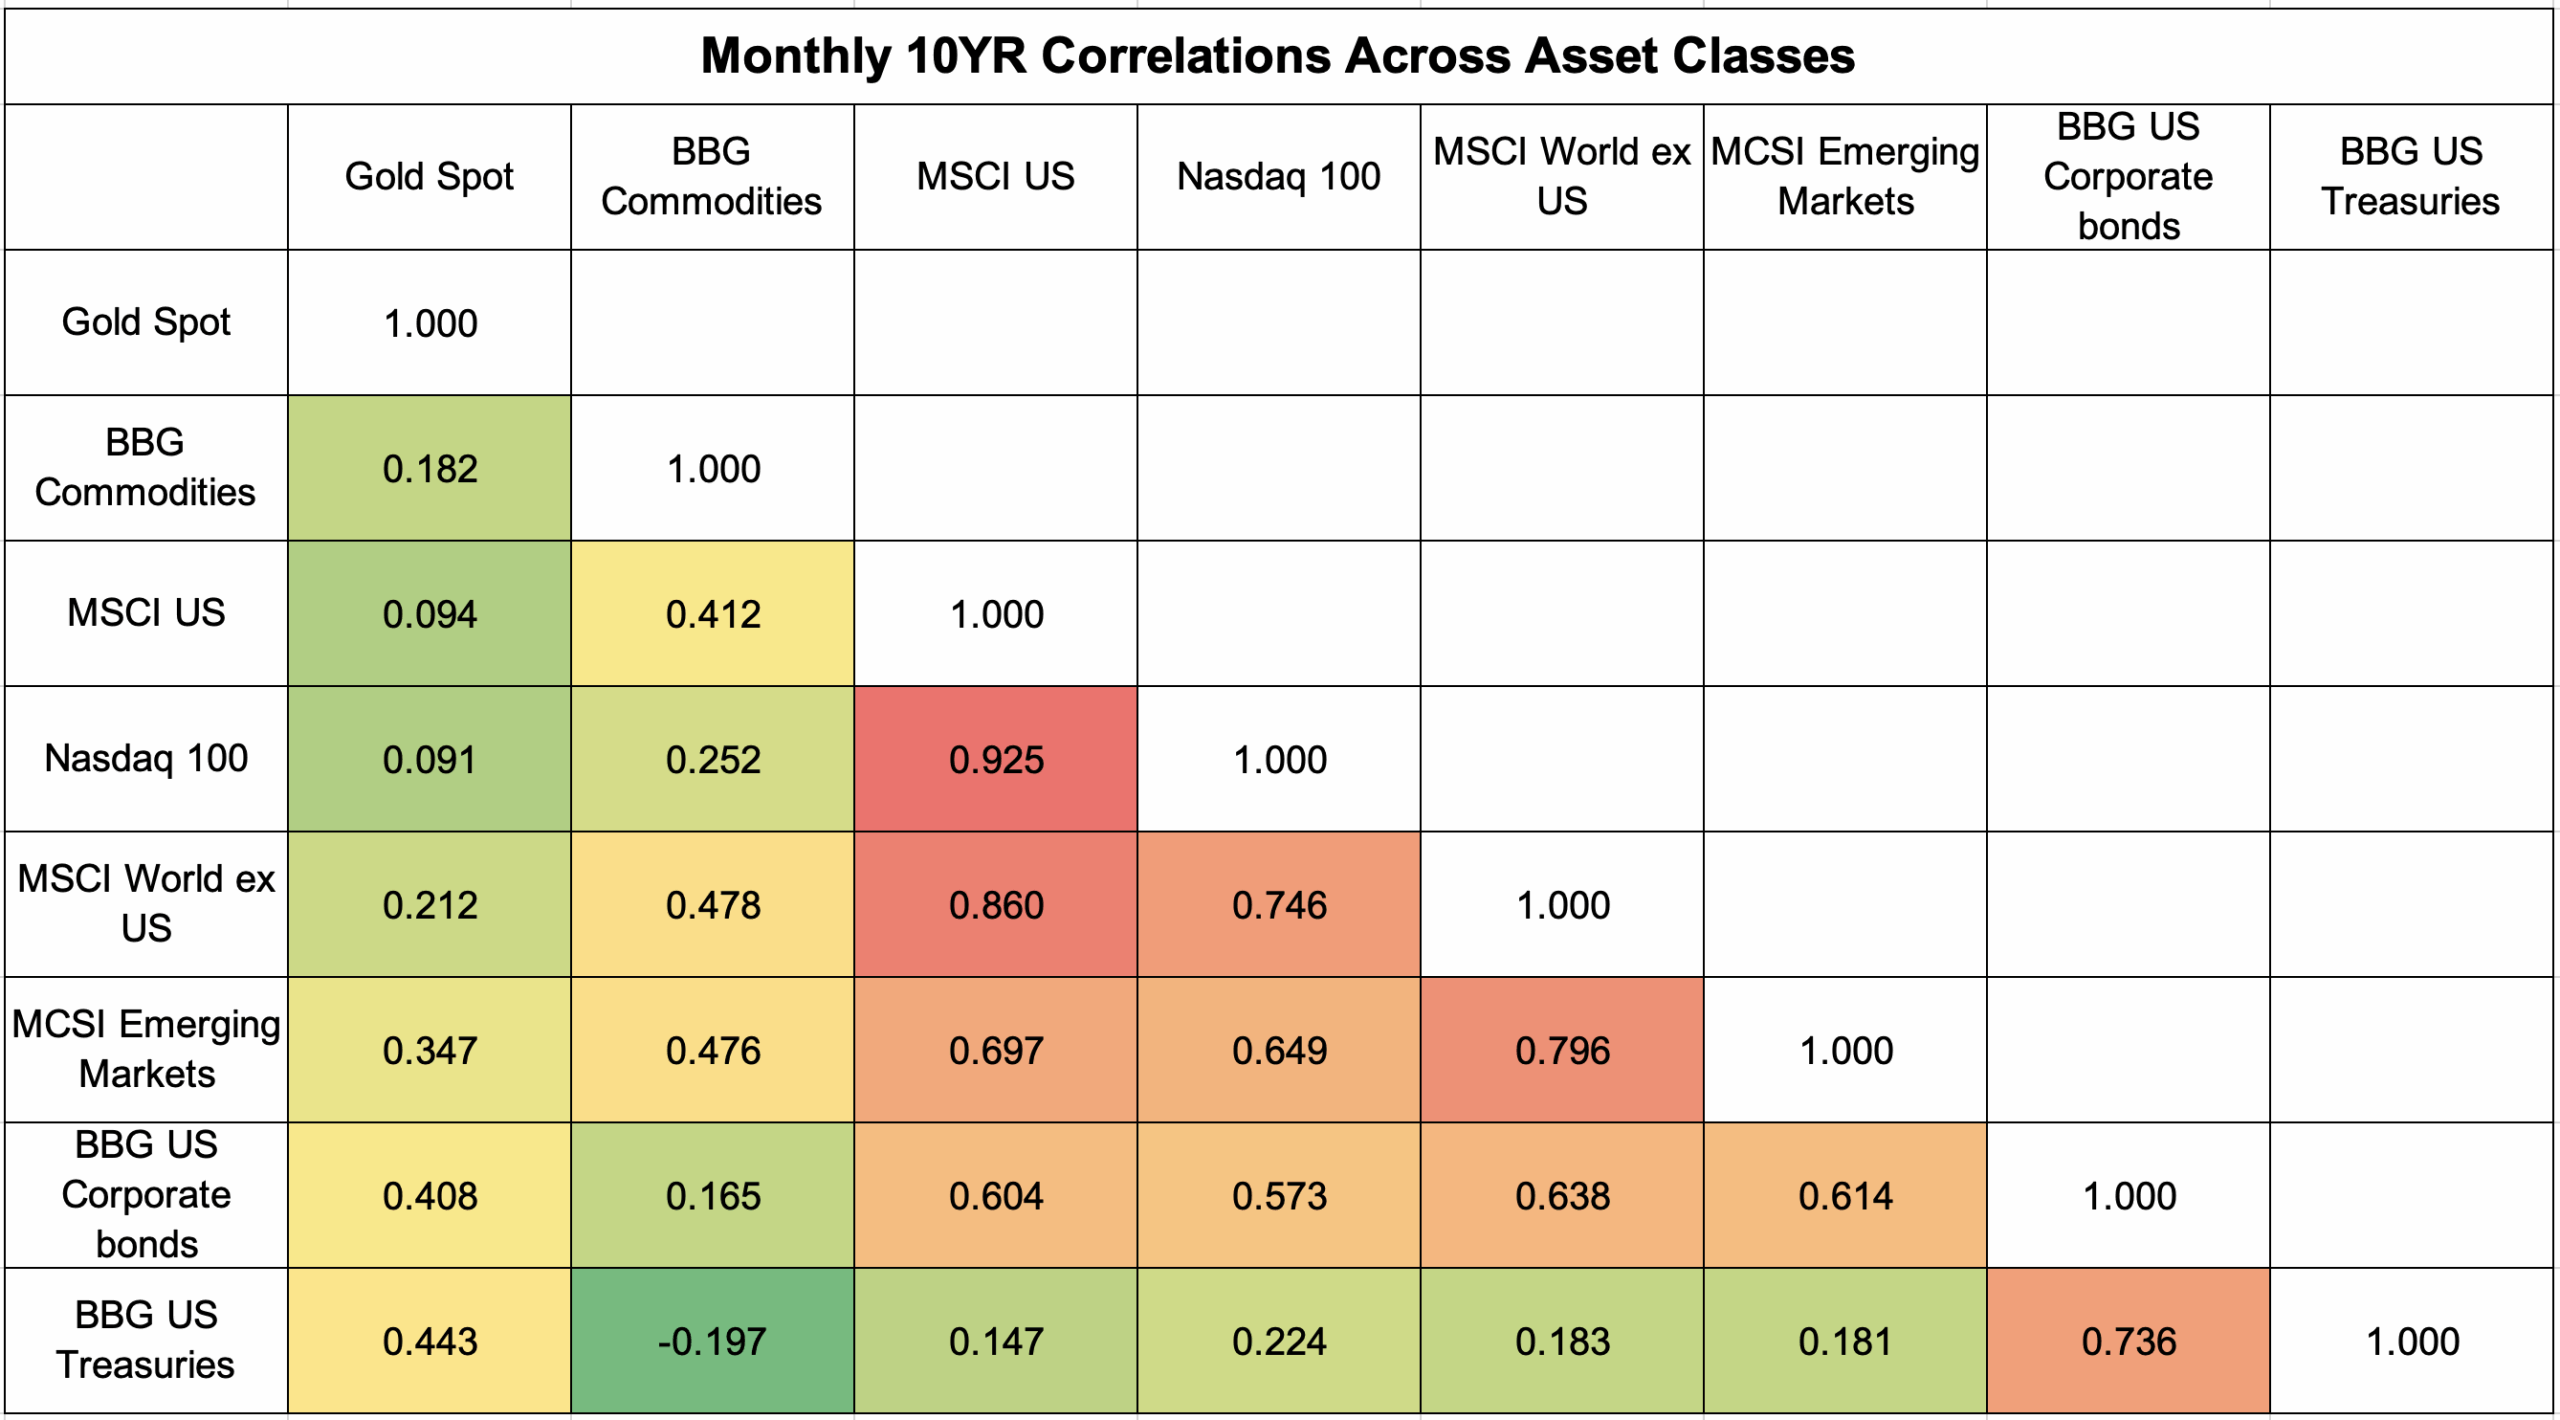
While gold’s volatility and lack of dividends or cash flow are drawbacks, gold’s unique characteristics mean it often behaves differently from other asset classes. Gold’s historically low correlation with other financial assets makes it attractive to some investors as part of a diversified portfolio. This is shown in the following correlation table. Correlation measures the degree to which two assets trade together, with a lower number signifying low correlation, a high number signifying high correlation (1.00 being two assets move in complete lockstep), and a negative number signifying that those two assets move opposite from one another. Each box below represents a correlation pair between the asset along the top row and its corresponding pair along the left-hand side column. As you can see, gold has many lower number green and yellow boxes compared to other assets with a higher number of orange and red correlation pairs.
Source: World Gold Council
Owning assets with low correlation is valuable in the context of portfolio construction since this is likely to reduce volatility, maximize risk-adjusted returns, and produce a smoother overall return profile over time.
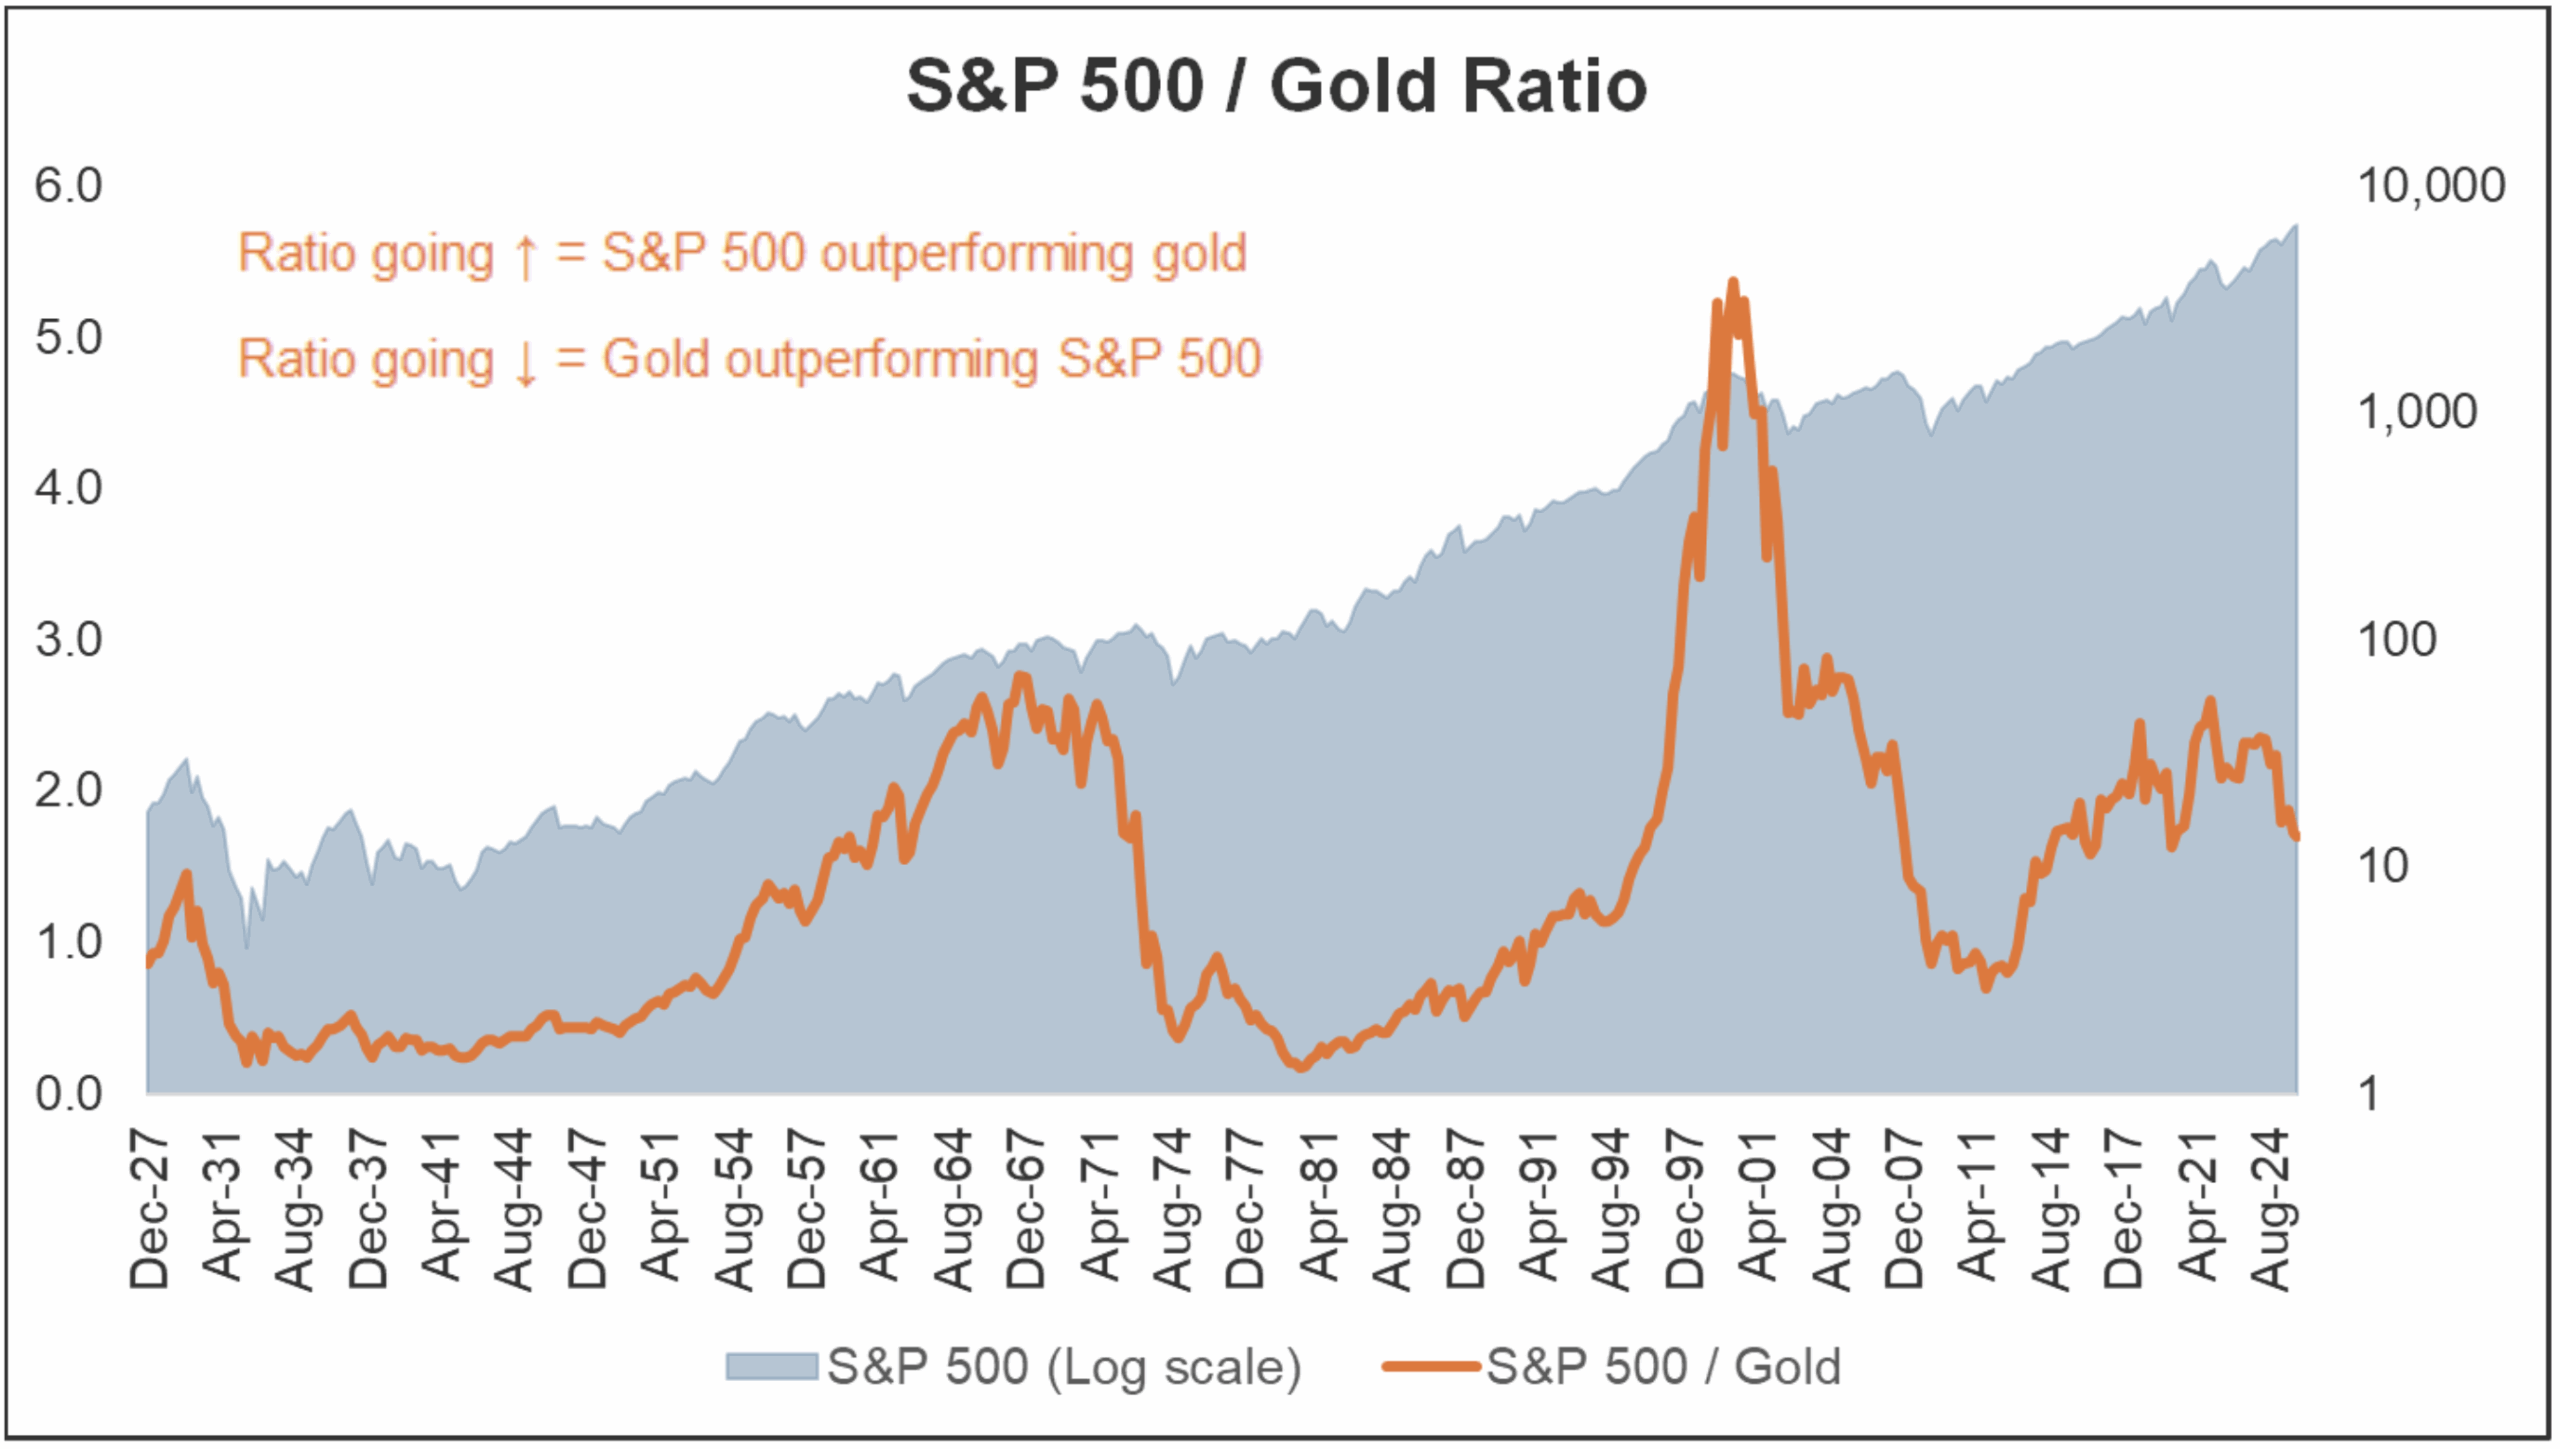
Looking at the long-term ratio of an asset vs. gold demonstrates this concept of correlation. Below I use the S&P 500 vs. gold. The ratio varies over time, indicating that these two assets move differently than one another. If these two assets were perfectly correlated, this ratio would maintain a flat slope throughout time. Historically, in many instances when the S&P 500 declines, the ratio also declines, indicating gold outperformance vs. the S&P 500. This relationship is one reason some investors have historically considered gold as part of a diversified portfolio. The current environment – where gold is outperforming the S&P 500 even as both rise – is relatively rare when compared to history. This serves as an important reminder that past performance results, including correlations with other investments, cannot be guaranteed to persist in the future.
Source: Bloomberg
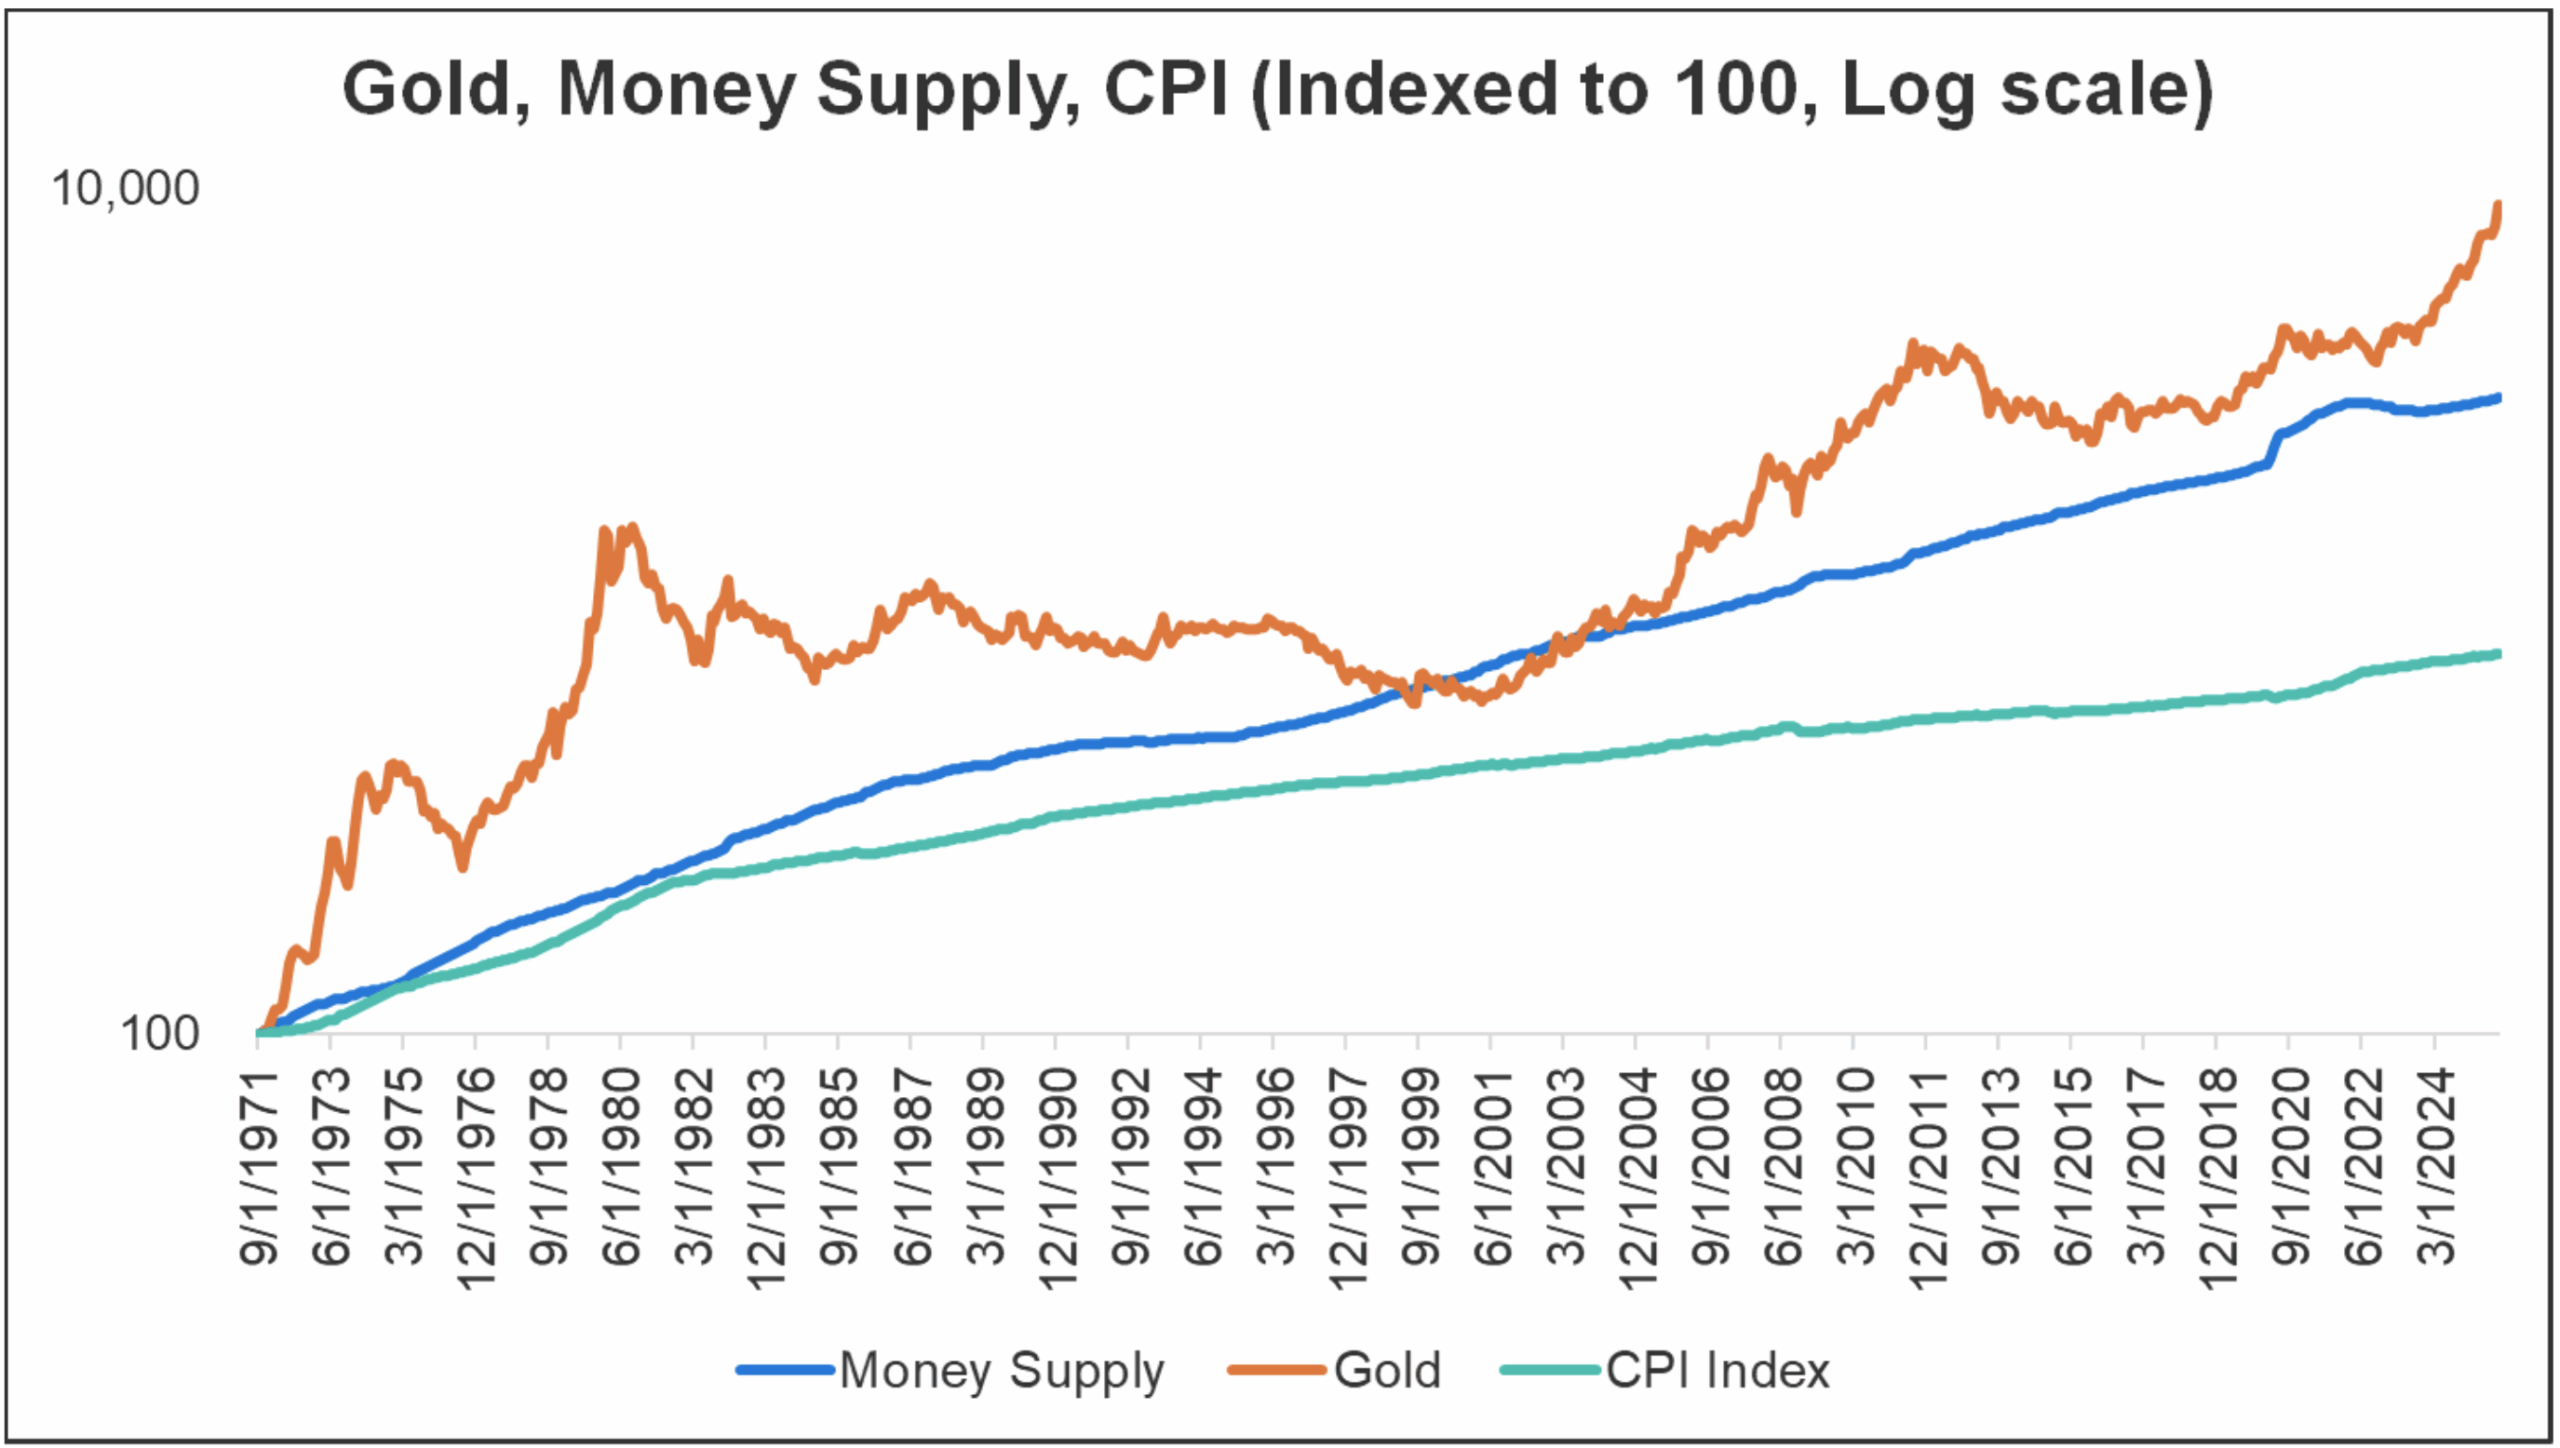
Gold has also been effective over the long term in preserving purchasing power when compared to the growth of both the money supply and CPI. One of the reasons contributing to this is gold’s scarcity value. In her book Broken Money, Lyn Alden wrote about this topic:
For example, gold miners add about 1.5% new gold to the estimated existing above-ground gold supply each year, and unlike most other commodities, most of the gold does not get consumed; it gets repeatedly melted and stored in various shapes and places.
The combination of continuously mining gold and rarely losing any of the mined gold has resulted in gold having a stock-to-flow ratio of about 100/1.5 = 67 on average, which is the highest stock-to-flow ratio of any commodity. The world collectively owns 67 years’ worth of average annual production, based on estimates by the World Gold Council. The supply growth rate has varied between 1% and 2% over the past century, which is a remarkably low and narrow band. Even in the 1970s when gold went up by an order of magnitude in terms of its dollar price, it couldn’t affect the annual supply growth as a percentage of existing holdings by much at all.
A commodity with a high stock-to-flow ratio is hard to produce, and yet a lot of it has already been produced and is widely distributed and held, because it either isn’t rapidly consumed or isn’t consumed at all. That’s a relatively uncommon set of attributes and what allows something to be money rather than merely a collectible.
Although above-ground gold increases in supply by approximately 1.5% per year on average, the broad money supplies of most major countries have grown at an annualized rate of between 6% and 12% since 1960, while the long tail of developing country currencies generally grew at double-digit rates or outright hyperinflated at some point within the period.
Source: Bloomberg
Alan Greenspan, chairman of the Board of Governors of the Federal Reserve from 1987-2006 has shared similar sentiments. In a talk at the Council on Foreign Relations in 2014, he said that “Gold is a currency. It is still by all evidences the premier currency where no fiat currency, including the dollar, can match it.”
Final Thoughts & Investor Takeaways
Investing in gold may not be suitable for every investor. Each individual has unique preferences, as well as specific risk and return objectives. When evaluating any asset class – including gold – it is important to consider how it fits within your overall portfolio and aligns with your personal goals. For those who choose to invest in gold, Morningstar suggests a holding period of at least 10 years to help smooth out potential short-term fluctuations.
In summary, gold may be able to play a unique role in a diversified portfolio, but it is essential to weigh its drawbacks and benefits in the context of your goals, risk tolerance, and investment horizon. While some investors include gold in their portfolios, others may find that a traditional stock and bond strategy better suits their objectives. As with any asset, there is no guarantee that gold will enhance portfolio outcomes.
Due to the differences between gold and assets like stocks and bonds, Howe & Rusling does not consider gold a core portfolio holding. However, our wealth managers can provide exposure to this asset as part of a broader financial plan if you deem it appropriate for your individual circumstances. Our role is always to ensure that each client’s strategy remains cohesive, diversified, and aligned with their long-term goals.
If you have further questions or would like to discuss whether gold may align with your own strategy, your Howe & Rusling wealth manager is always available and ready to provide personal guidance tailored to you.
Disclosures: This material is provided for informational and educational purposes only and does not constitute investment, tax, legal, or accounting advice, nor does it constitute an offer to sell or a solicitation to buy any security. The information contained herein reflects the opinions of the author as of the date of publication and is subject to change without notice. Any reference to an investment’s past performance is not indicative of, and does not guarantee, future results. Historical returns, correlations, volatility, demand, and other market data presented are based on past events and may not persist in the future. Certain statements may contain forward-looking views, which are inherently speculative, subject to numerous assumptions, and may not materialize. Investing in gold or gold-related securities involves risk, including loss of principal. Gold does not produce income, dividends, or cash flows, and its value may be influenced by market demand, geopolitical events, interest rates, currency movements, and investor sentiment. Exposure through exchange-traded funds or other vehicles may involve additional risks, including counterparty risk, liquidity risk, tracking error, and differences between spot gold prices and security prices. Diversification does not ensure a profit or protect against loss in declining markets. Portfolio allocations or investment strategies discussed may not be suitable for all investors and should be considered in light of an individual’s objectives, risk tolerance, and financial circumstances. Howe & Rusling does not consider gold a core portfolio holding. Any allocation is considered only within the context of a broader financial plan, based on client goals and preferences. Index performance is presented for illustrative purposes only. You cannot invest directly in an index. Indexes referenced may not reflect the deduction of fees, trading costs, or other expenses that would reduce actual investment returns. Data sources believed to be reliable include: Bloomberg, World Gold Council, World Economic Forum, International Monetary Fund (IMF), Federal Reserve, State Street Global Advisors, World Bank Group, and Encyclopedia Britannica. Howe & Rusling makes no representations or warranties as to the accuracy or completeness of third-party data. Citations to third parties do not imply endorsement. Any quoted individuals or entities—including Alan Greenspan, Lyn Alden, Citibank, or others—are referenced for context and informational purposes only and do not constitute endorsements of Howe & Rusling or its services. Howe & Rusling is an SEC-registered investment adviser located in Rochester, NY. Registration with the SEC does not imply a certain level of skill or training.